
NoteAirbridge supports two types of conversion value settings.
- SKAN 4.0: For Airbridge Apps registered after November 18, 2024, the SKAN 4.0 conversion value settings will be applied by default and cannot be changed.
- SKAN 3.0: Airbridge Apps with the SKAN 3.0 conversion value settings applied before November 18, 2024, will retain those settings. If you wish to switch to SKAN 4.0, contact your Airbridge CSM. If you don’t have a designated CSM, contact the Airbridge Help Center. Once you switch from SKAN 3.0 to SKAN 4.0, switching back to SKAN 3.0 is not possible.
AttentionAirbridge iOS SDK version 1.14.3 or later is required to use the conversion value rules you set on the [SKAN Conversion Value] page. If you have integrated or planning to integrate Airbridge with your Apple Search Ads account, you must update the Airbridge iOS SDK version to 1.15.3 or later. Moreover, the Airbridge iOS SDK version must be 1.28.1 or later to use decimal point numbers in creating revenue ranges when setting the conversion value rules for measuring revenue.
SKAN Conversion Value Rule Setting
Select [Management] from the left sidebar and select [SKAN Conversion Value] to set your SKAN conversion values. Click the “Configure” button with the [gear] icon. The in-app events and event properties assigned to the conversion values are tracked for 24 hours when a user installs the app. If the conversion values are not set, Airbridge tracks only app install events by default using SKAN.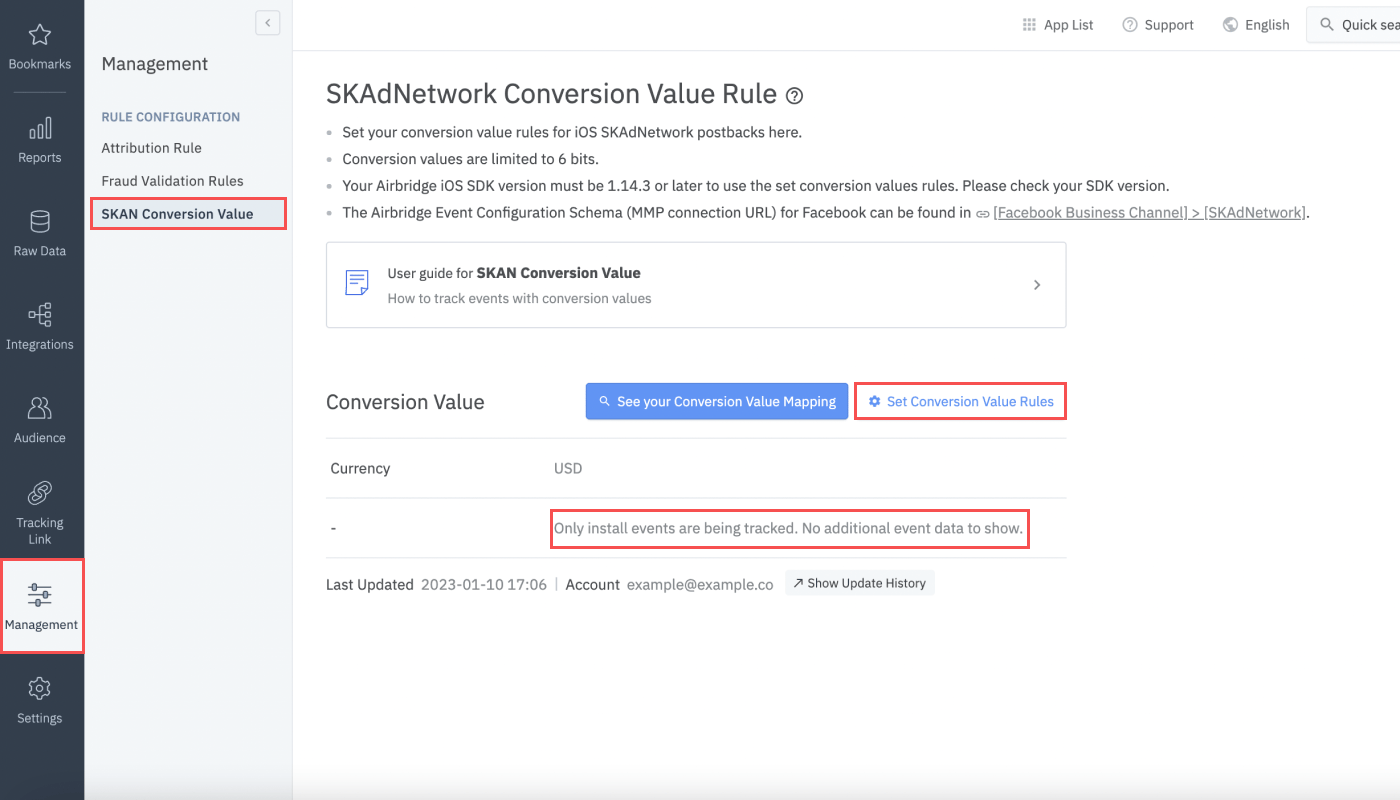
Measurement Components
NoteFrom January 5, 2023, the measurement components on the [SKAN Conversion Value] page are displayed by new names. The conversion values set before January 5, 2023, are not affected by this change, and no actions are needed to continue with campaign performance tracking with SKAN.
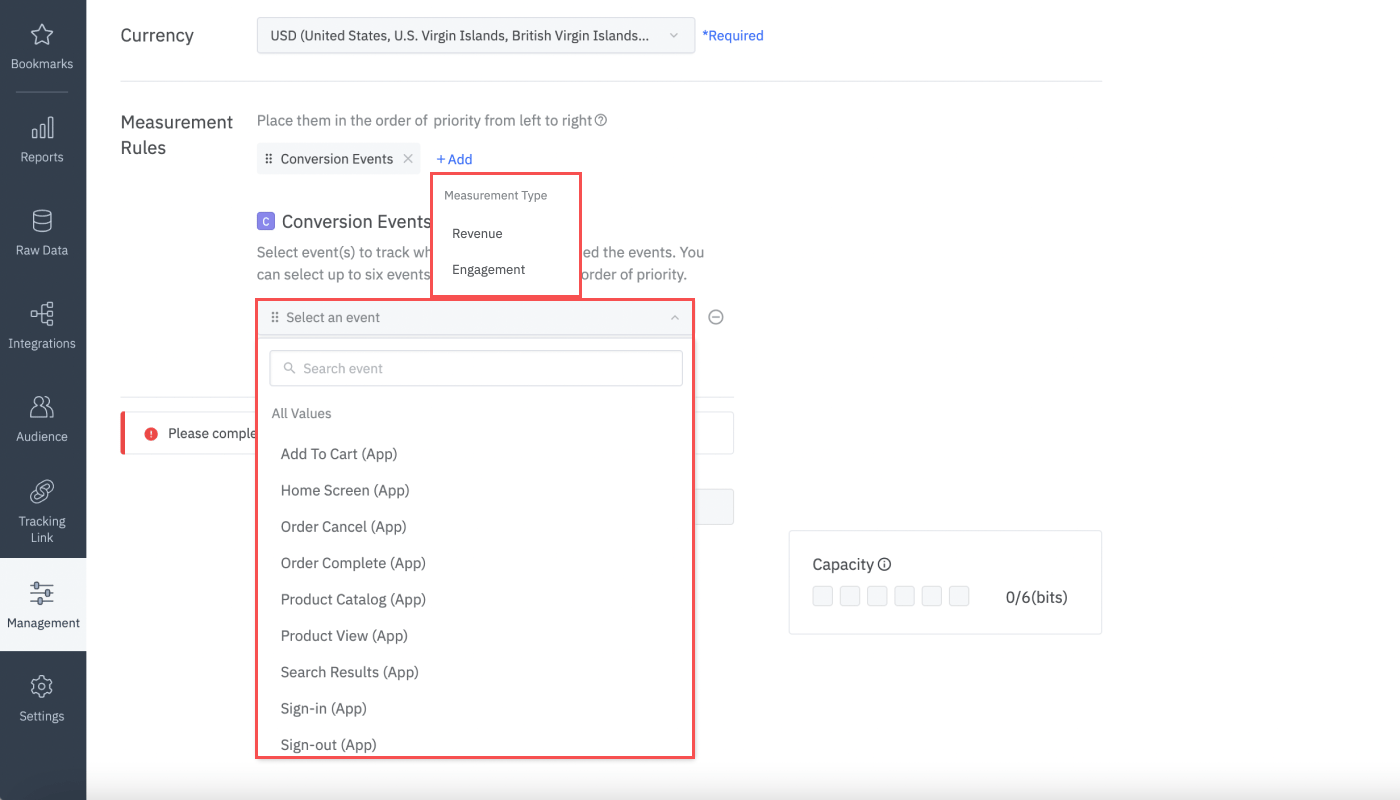
Conversion Events
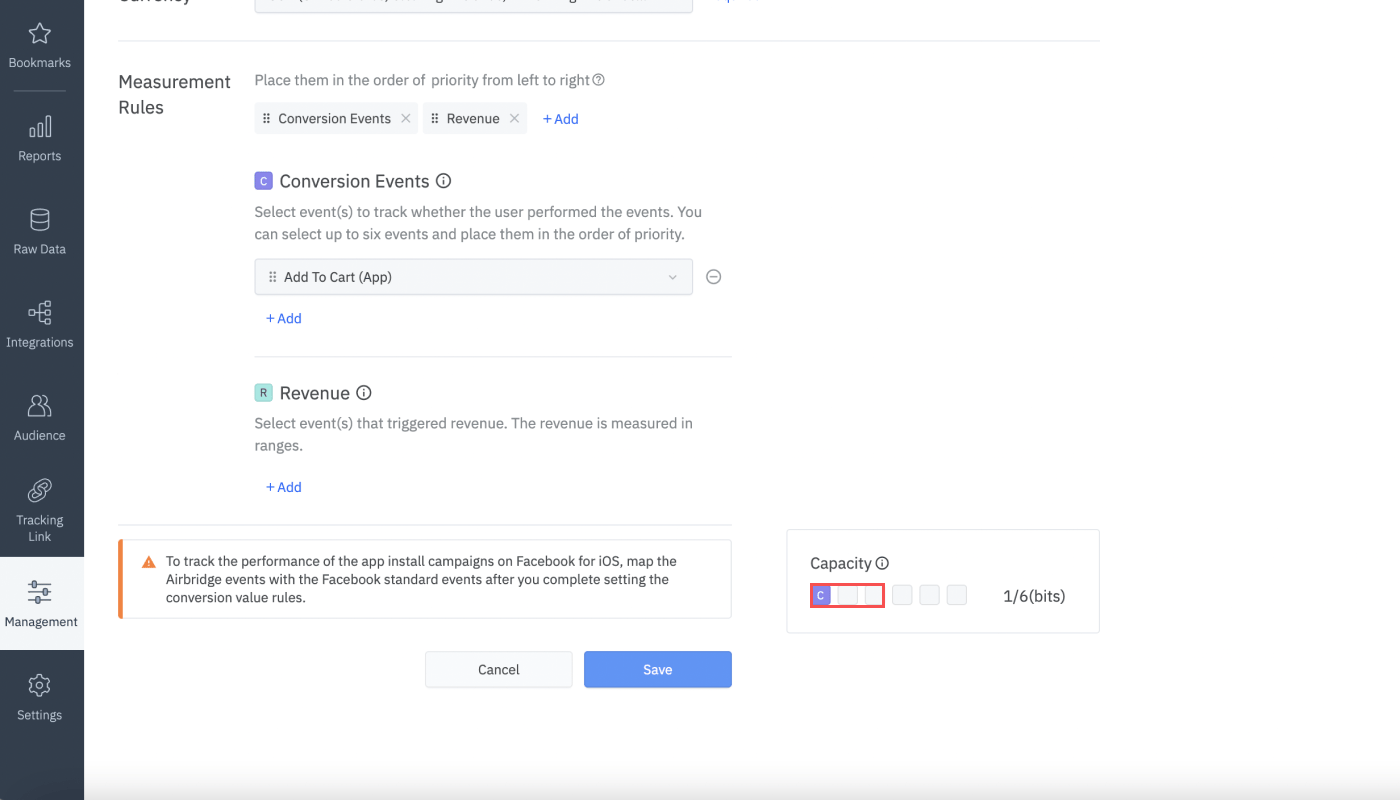
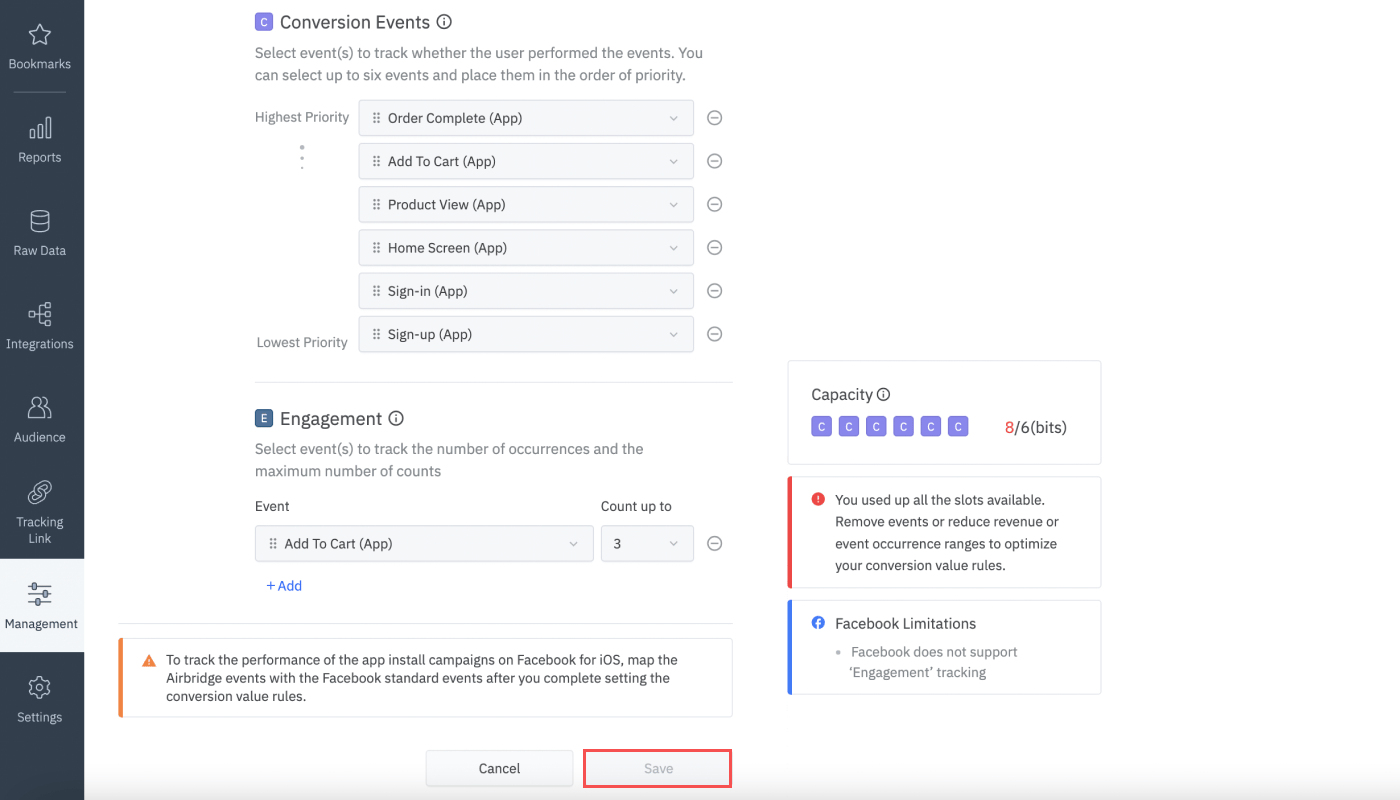
You can determine whether the selected events occurred within 24 hours post-install. As you add events to track, the capacity boxes are filled with the alphabet “C,” which stands for “Conversion.” When all boxes are filled, you can add no more events.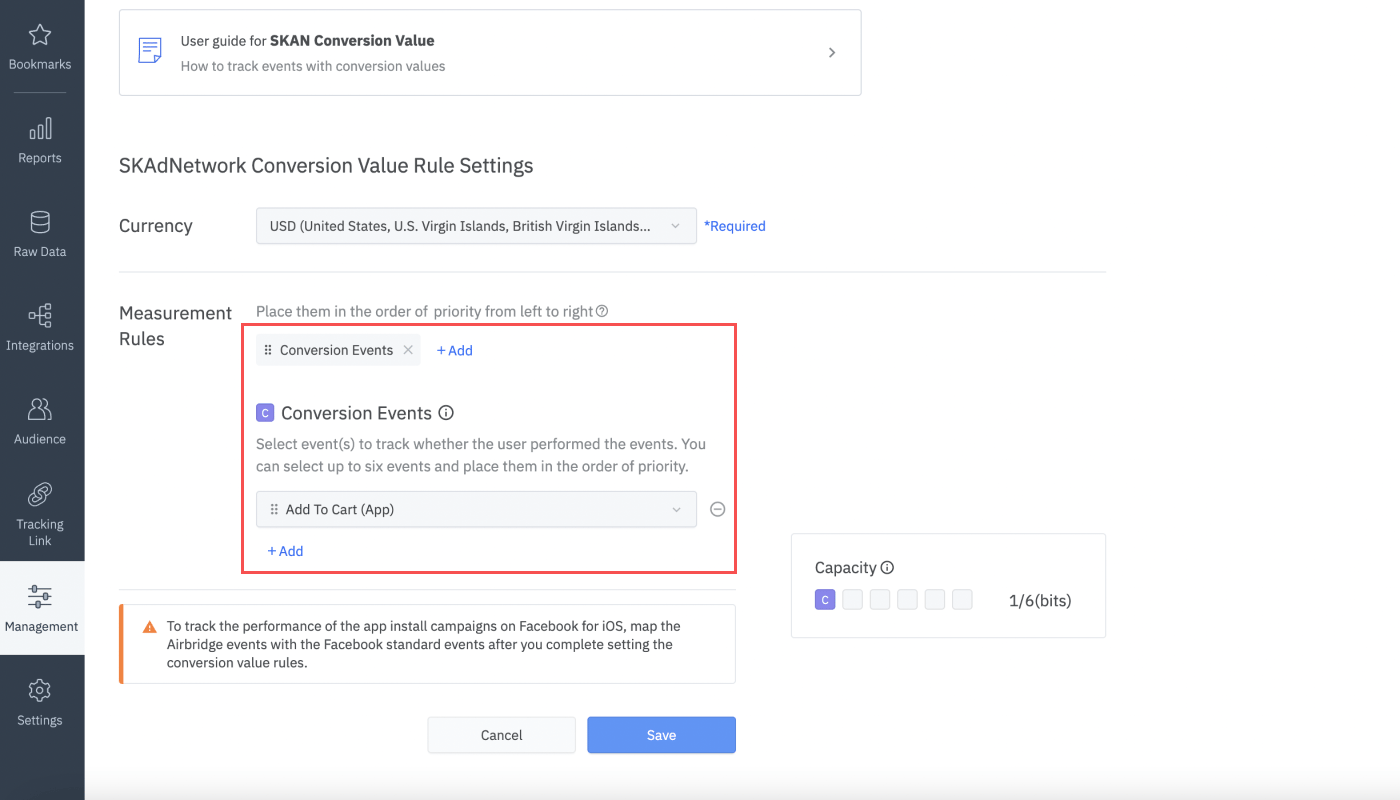
Revenue
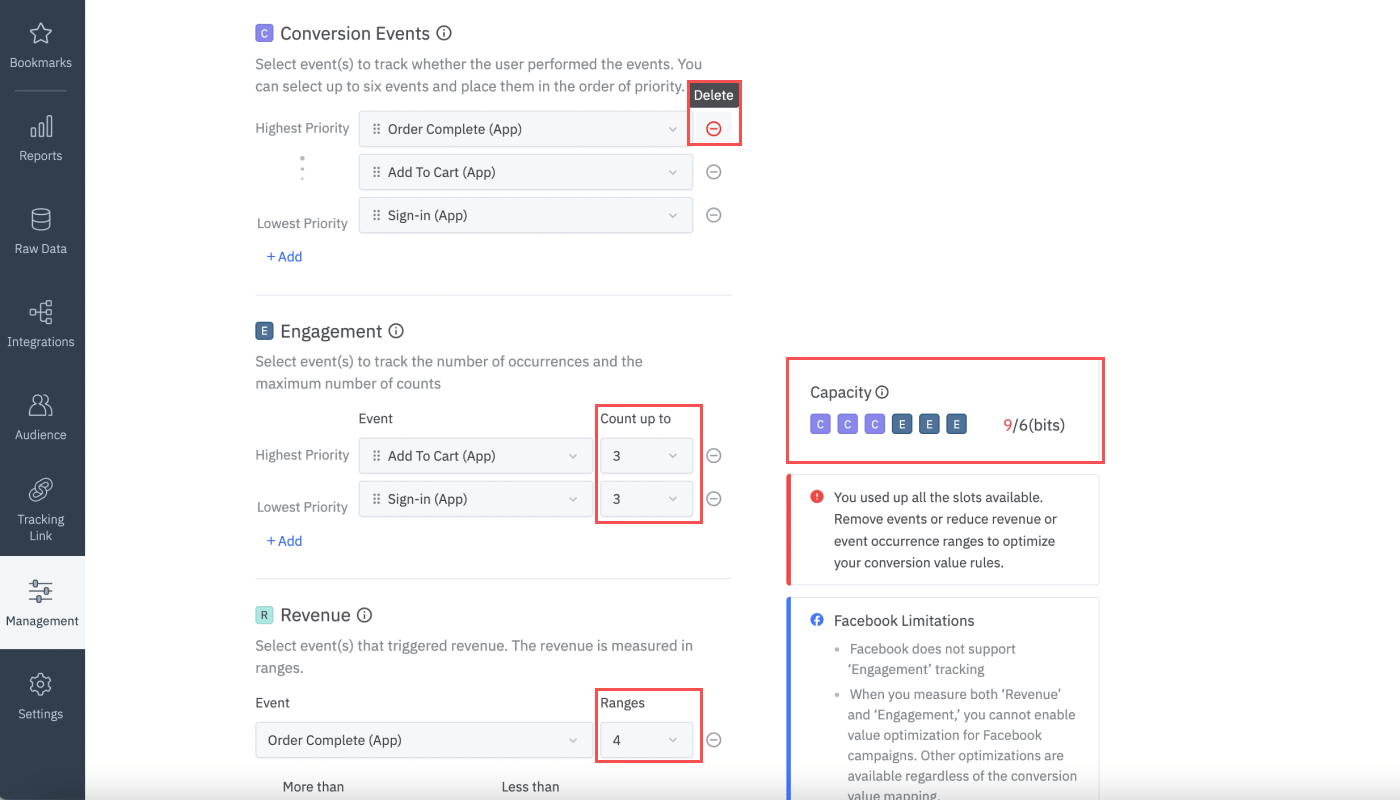
You can measure the revenue generated by the user who performed the selected event(s) within 24 hours post-install using revenue ranges. You can create 4, 8, 16, 32, or 64 revenue ranges for each event. Creating 2 revenue ranges is not an option because that would merely allow you to determine whether a user performed the event or not. The more ranges you create, the more capacity boxes are filled with the alphabet “R,” which stands for “Revenue.” When you create 64 ranges, all boxes will be filled with “R”s. The currency displayed in the revenue range fields is the app standard currency of your app set by the admin when the app was registered in Airbridge. Numbers to two decimal places can be entered in the range fields. After you define the first range by entering a value, click the [↓] icon to auto-fill the rest of the fields and create ranges in the same intervals. The auto-fill button is not available for the first and last ranges.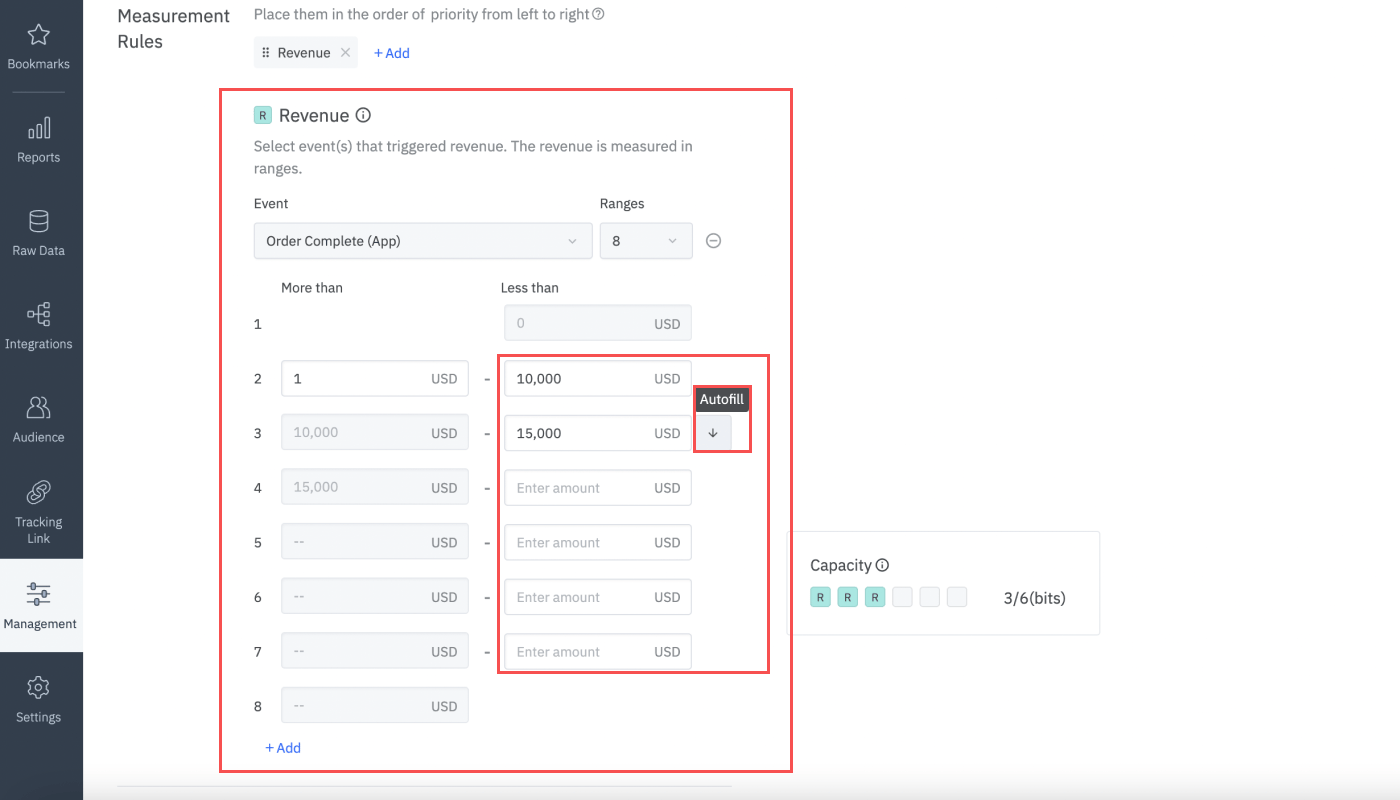
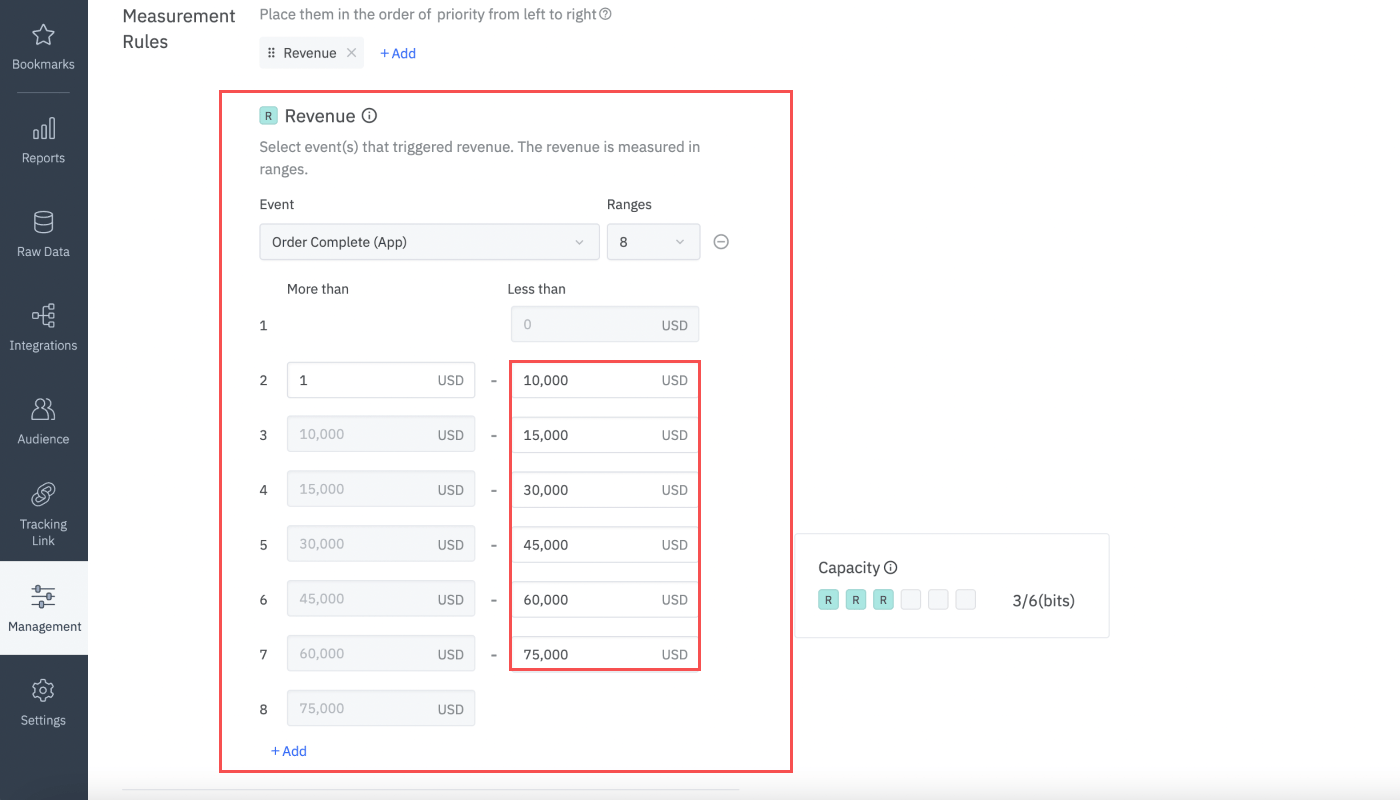
AttentionTo enable value optimization in Meta ads, measure the revenue in at least 4 ranges. You cannot enable value optimization with fewer than 4 ranges. We recommend measuring the revenue in at least 8 ranges when value optimization campaigns account for 50% to 70% of your total ad budget.For details, see About value sets in the Meta Business Help Center.
Engagements
You can track the number of times a user performed the selected event(s) within 24 hours after installing the app. Airbridge tracks the events up to a set number of times. For example, when you set a certain event to be counted up to 3 times, and that event occurs 4 times, the event will be tracked to have occurred 3 times. The number of times counted for a certain event occurrence can be selected from 3, 5, 15, 31, or 63 times. It is not possible to set the number to 1 because it would be the same as tracking “Conversion Events.” The bigger the maximum number of counts you select, the more capacity boxes are filled with the alphabet ‘E” which stands for “Engagement.”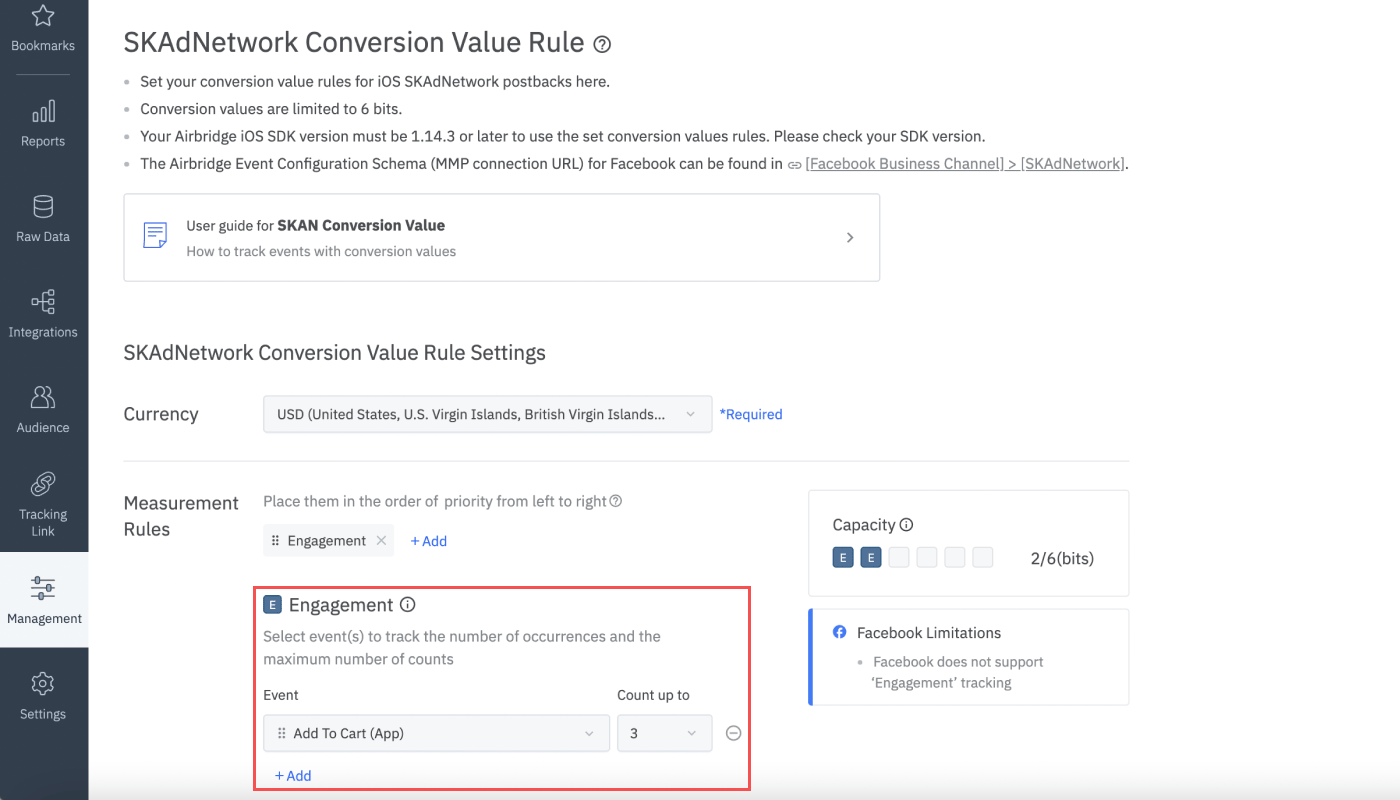
Attention“Engagement” cannot be measured for Facebook Business (Meta) campaigns. When you measure both “Revenue” and “Engagement,” Facebook’s value optimization can’t be enabled. Other optimizations are available regardless of the conversion value mapping.
Capacity
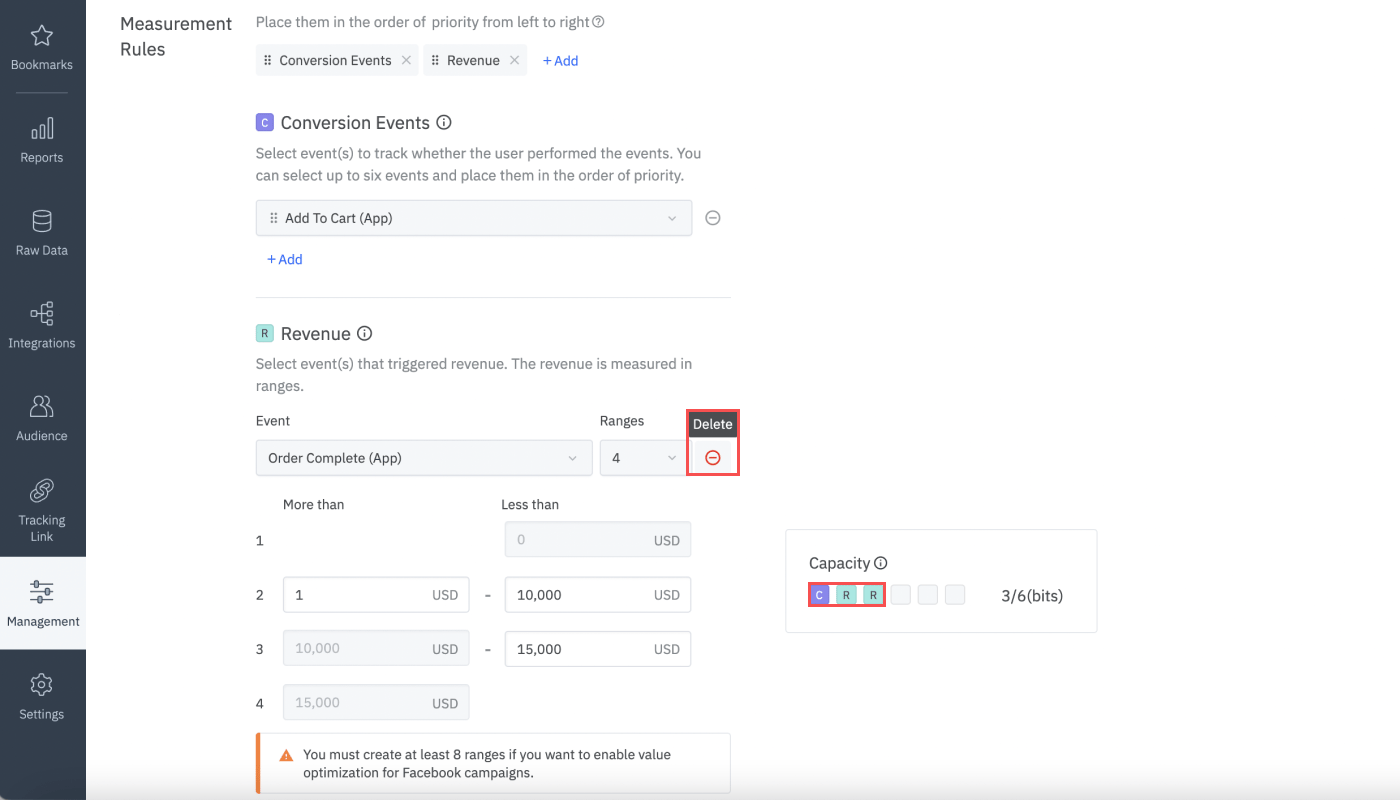
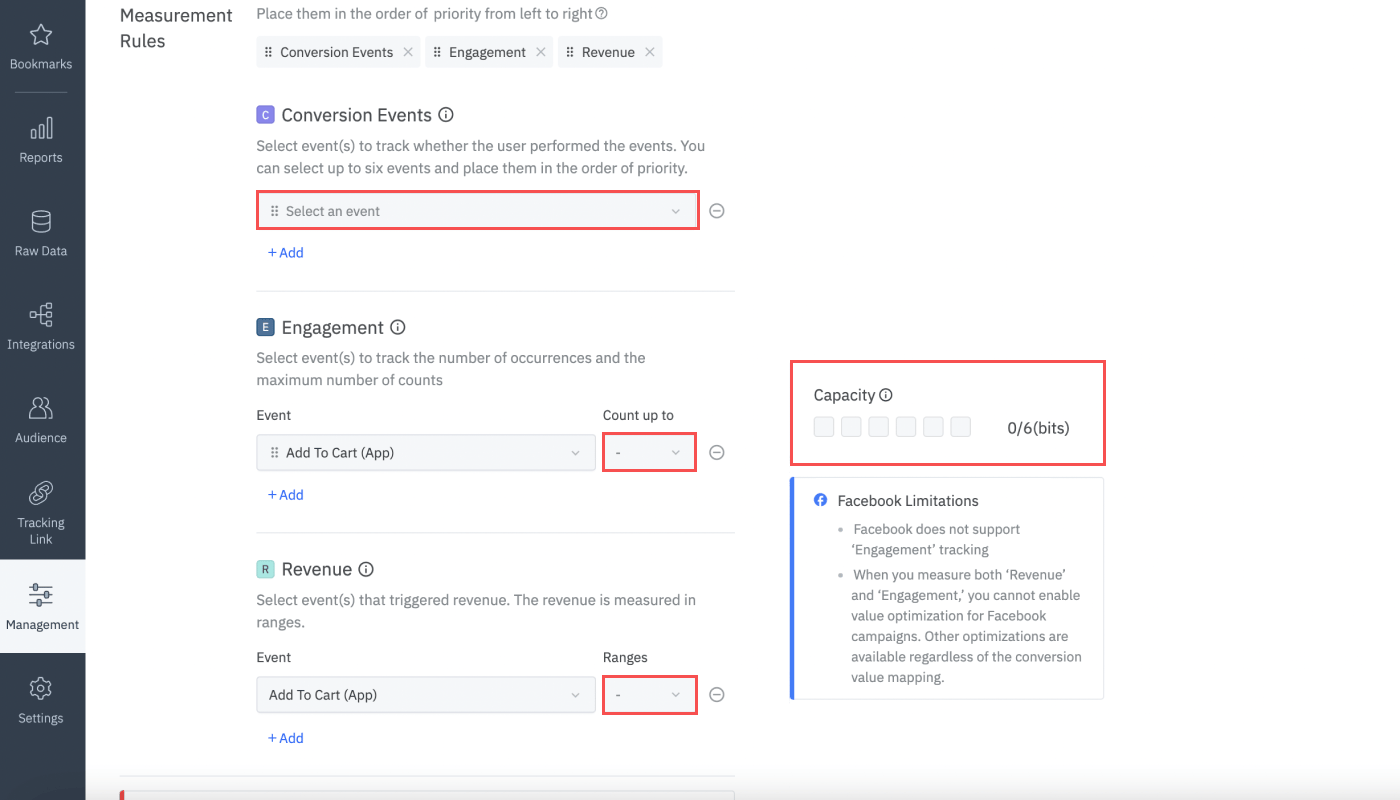
The capacity boxes show the number of bits used to save the events and event property values you selected per measurement component. Conversion values are defined by 6 bits, which are binary measures that hold only two values: 0 or 1.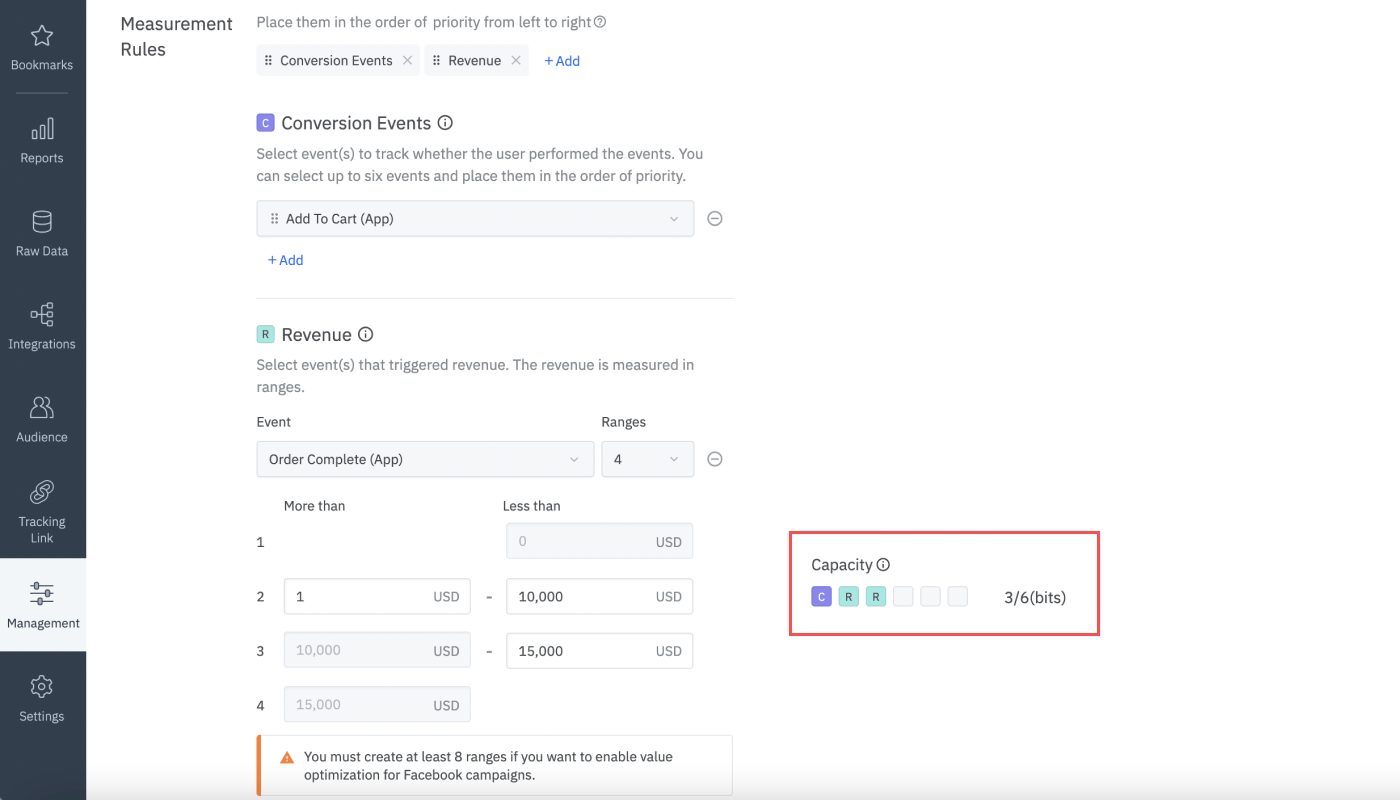
The number of bits used for the conversion value mapping is visualized in capacity boxes that are filled or emptied depending on what you select or unselect to track.
Mapping Examples
There are many ways to map events and event properties to the conversion values. You may choose only one measurement component or choose all three to track events. You can track a single event using several measurement components. For example, you can track whether a user performed the “Add To Cart” event, how many times the user performed the “Add To Cart” event, and how much revenue was generated by the user who performed the “Add To Cart” event. You should carefully consider what certain events mean to your business and the purpose of tracking the events when setting the conversion values. Read on and learn how to set your conversion values and get the most out of SKAN.Measure Conversion Events and Engagement
Conversion Events
This measurement component is useful if you want to determine whether several events occurred. Up to 6 events can be selected.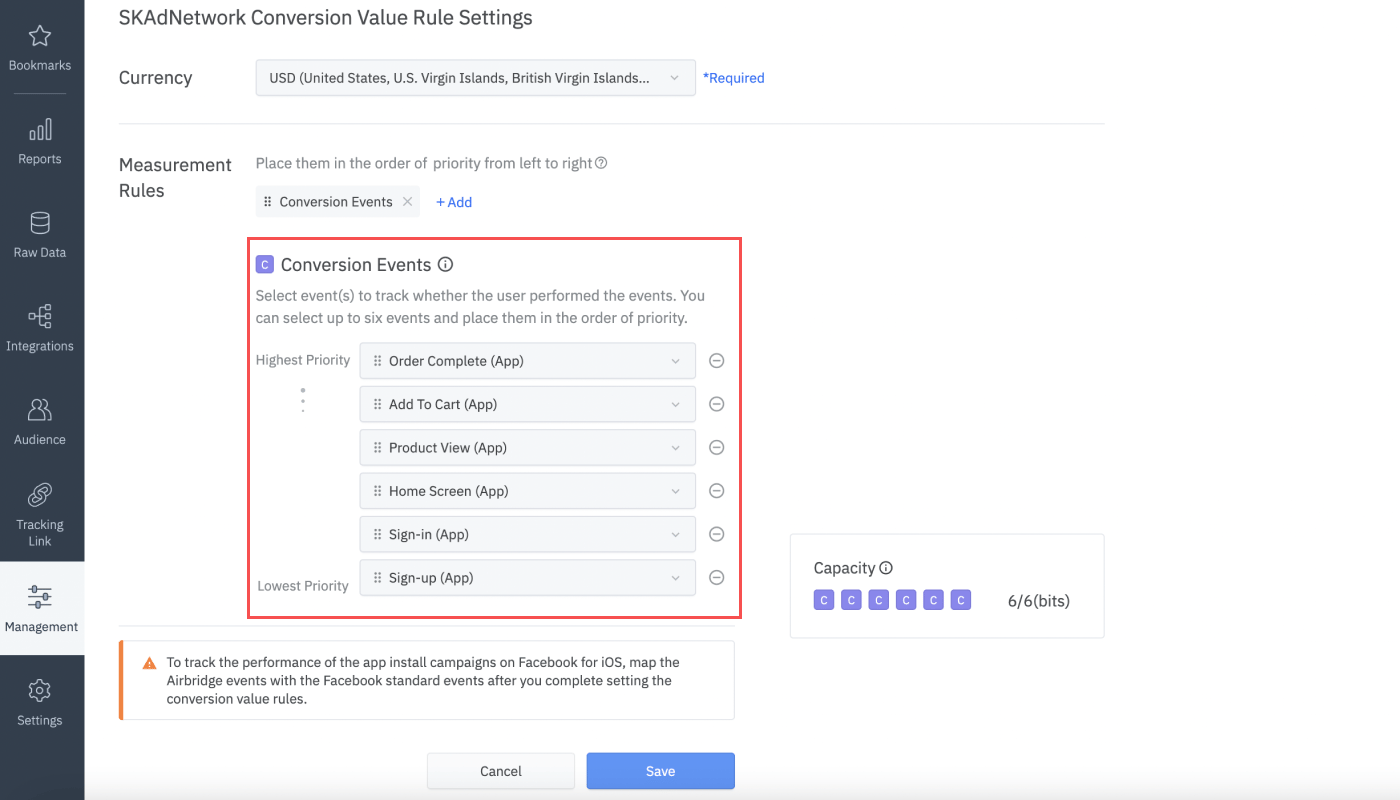
Engagement
This measurement component is useful when it is necessary to track the number of times the events occurred. Due to the 6-bit limitation, you can select three events to count up to a minimum of 3 occurrences or one event to count up to a maximum of 63 occurrences.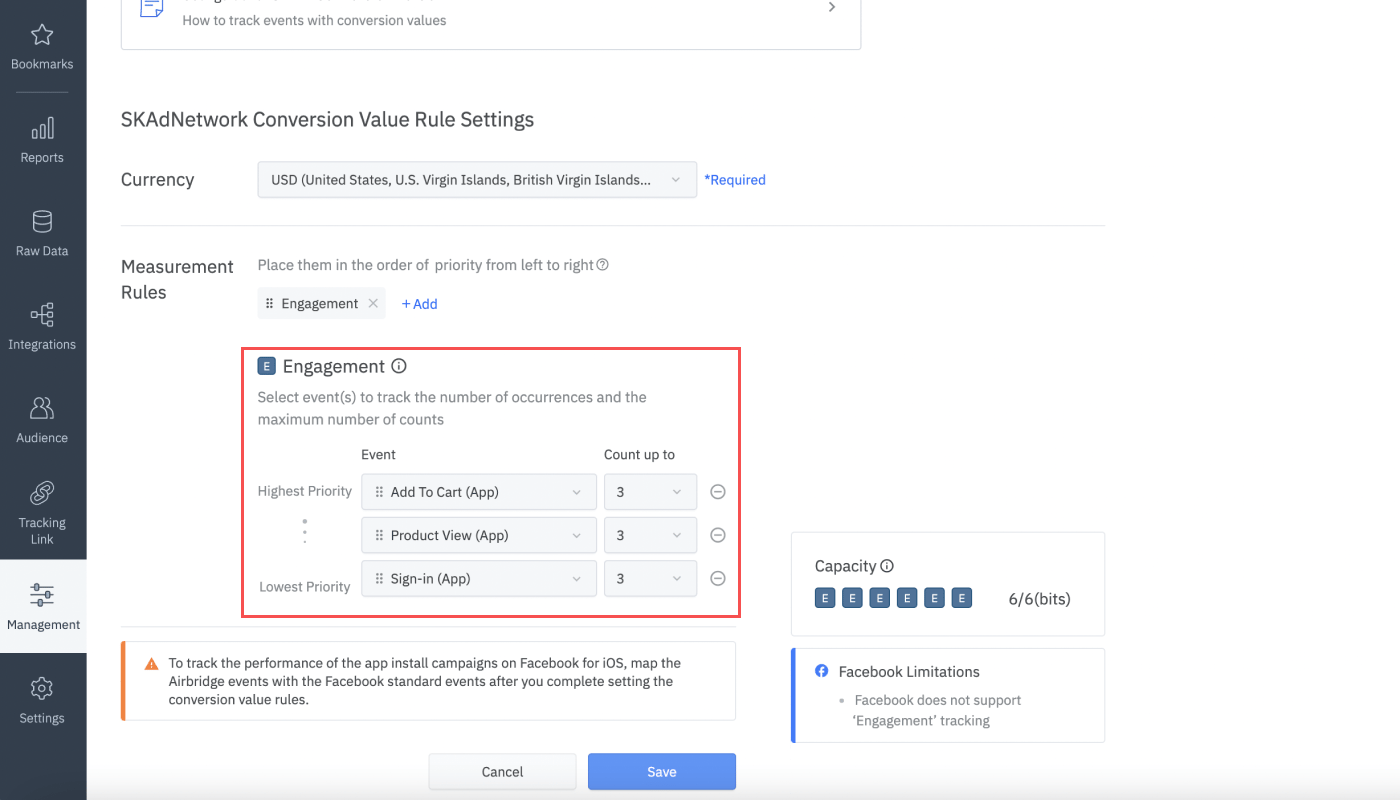
Conversion Events and Engagement
You can select events for both measurement components. This combination is helpful when you want to know whether users performed certain events and also track the number of times the events occurred.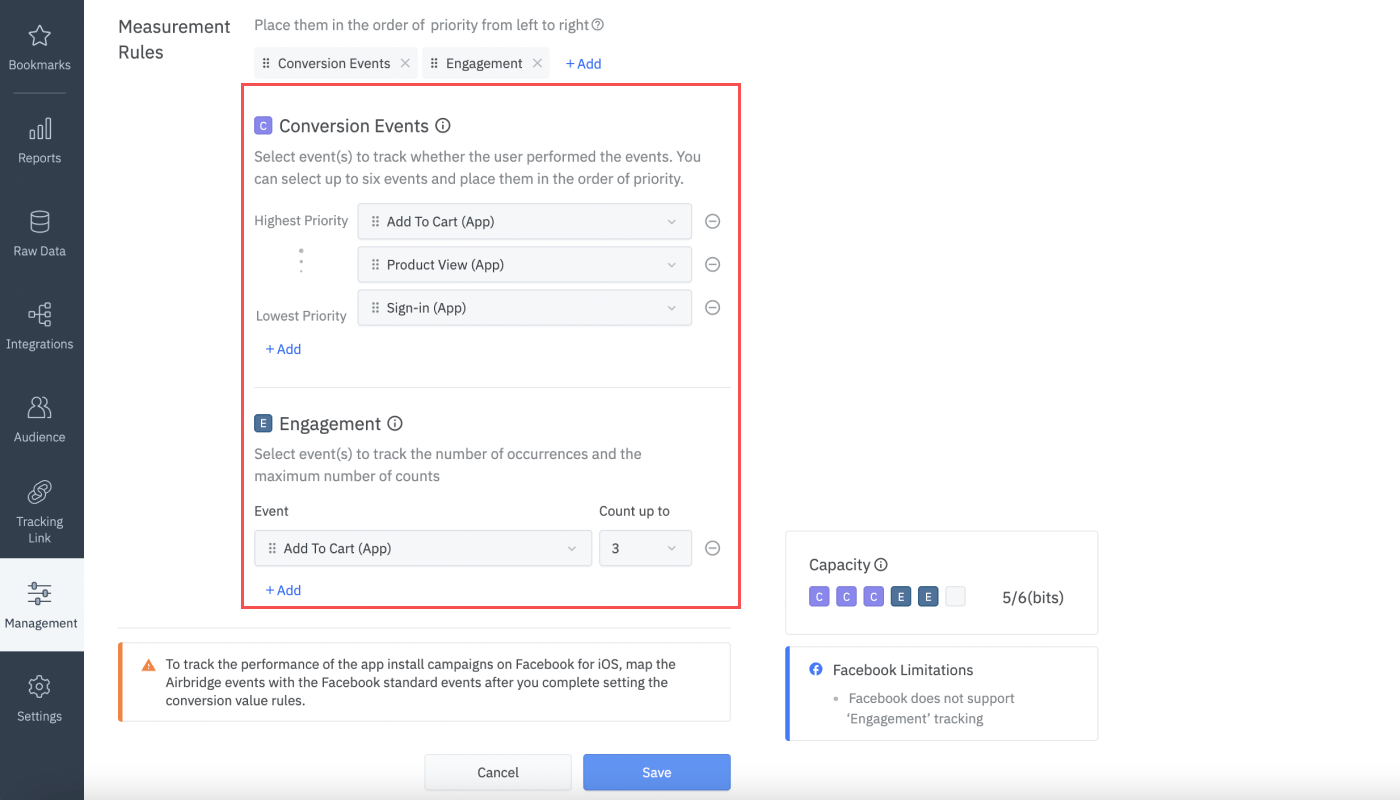
As indicated in the last row of the table, when you select two events under “Engagement,” you can track each event up to 3 counts, and in that case, you can select only two events under “Conversions Events.”
Measure Revenue
Revenue
You can select events under “Revenue’” and measure the revenue generated by the users who performed the events in ranges. You can create 4 ranges for 3 events or 64 revenue ranges for one event. This measurement type is helpful when you want to measure the revenue generated by users who performed several events or when you want to get a more granular view of the revenue generated by the users who performed a certain event.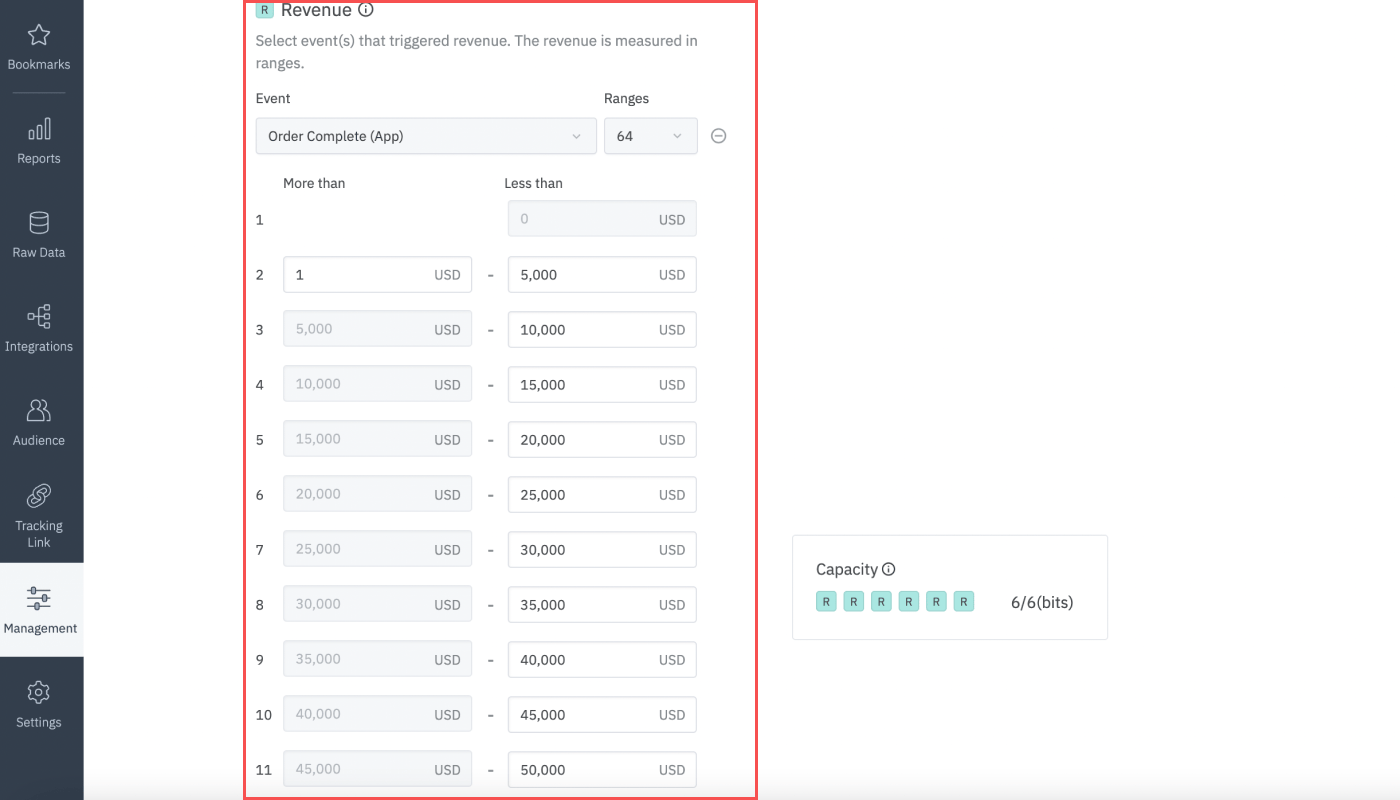
Conversion Events and Revenue
Select “Conversion Events” and “Revenue” when you want to see whether users performed certain events and also track the revenue generated by users who performed the events.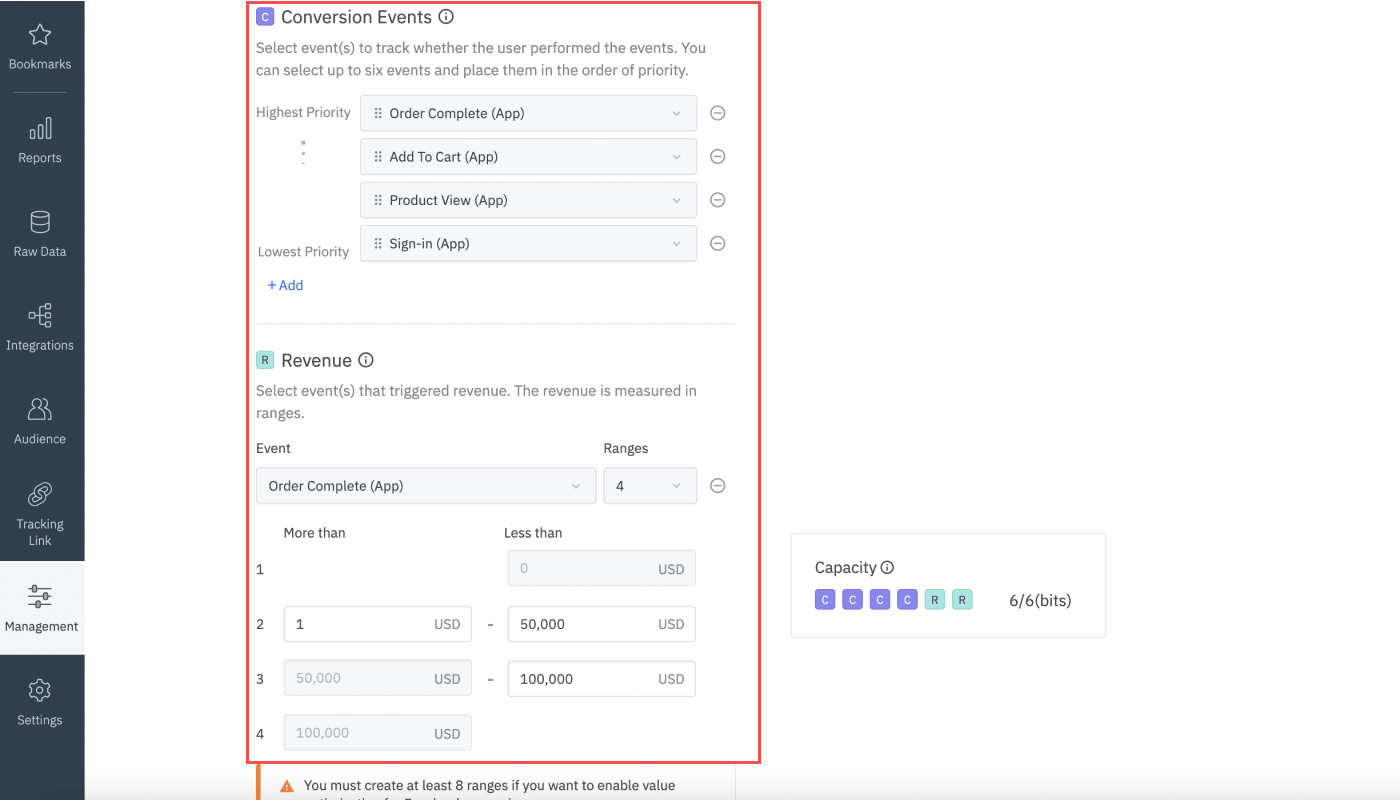
As indicated in the last row of the table, if you select “Event 1” and “Event 2” under “Revenue,” you can create 4 ranges for each of the events and select 2 events under “Conversion Events.”
Revenue and Engagement
This combination is useful when you want to measure the revenue generated by users who performed certain events and the number of times certain events occurred.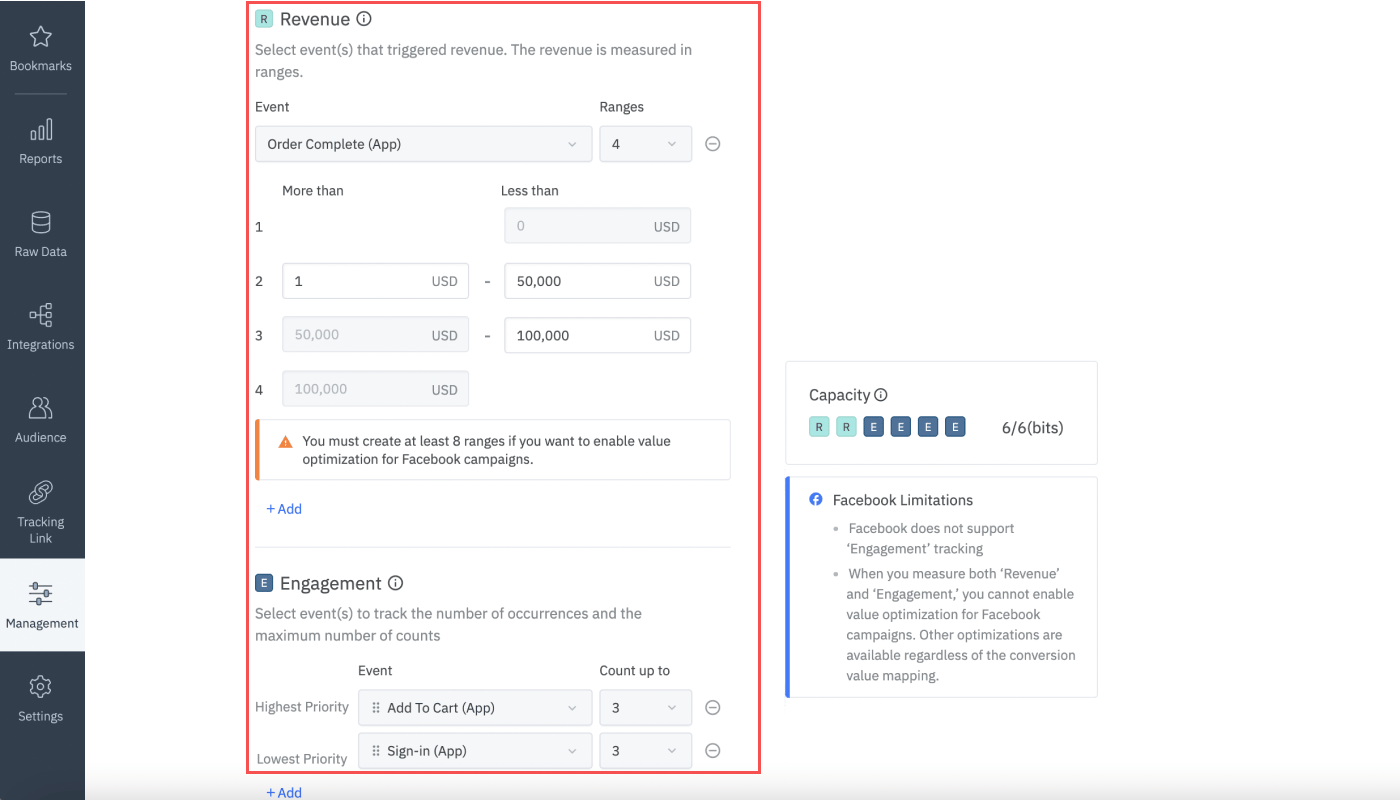
As indicated in the last two rows of the table, you can select 2 events under “Revenue” or 2 events under “Engagement.” If you select 2 events under “Revenue,” the maximum number of times you can select to count the event occurrence under “Engagement” is 3. If you select 2 events under “Engagement,” the maximum number of ranges you can create for an event under “Revenue” is 4.
Conversion Events, Revenue, and Engagement
You can select events under all three measurement components- “Conversion Events,” “Revenue,” and “Engagement.”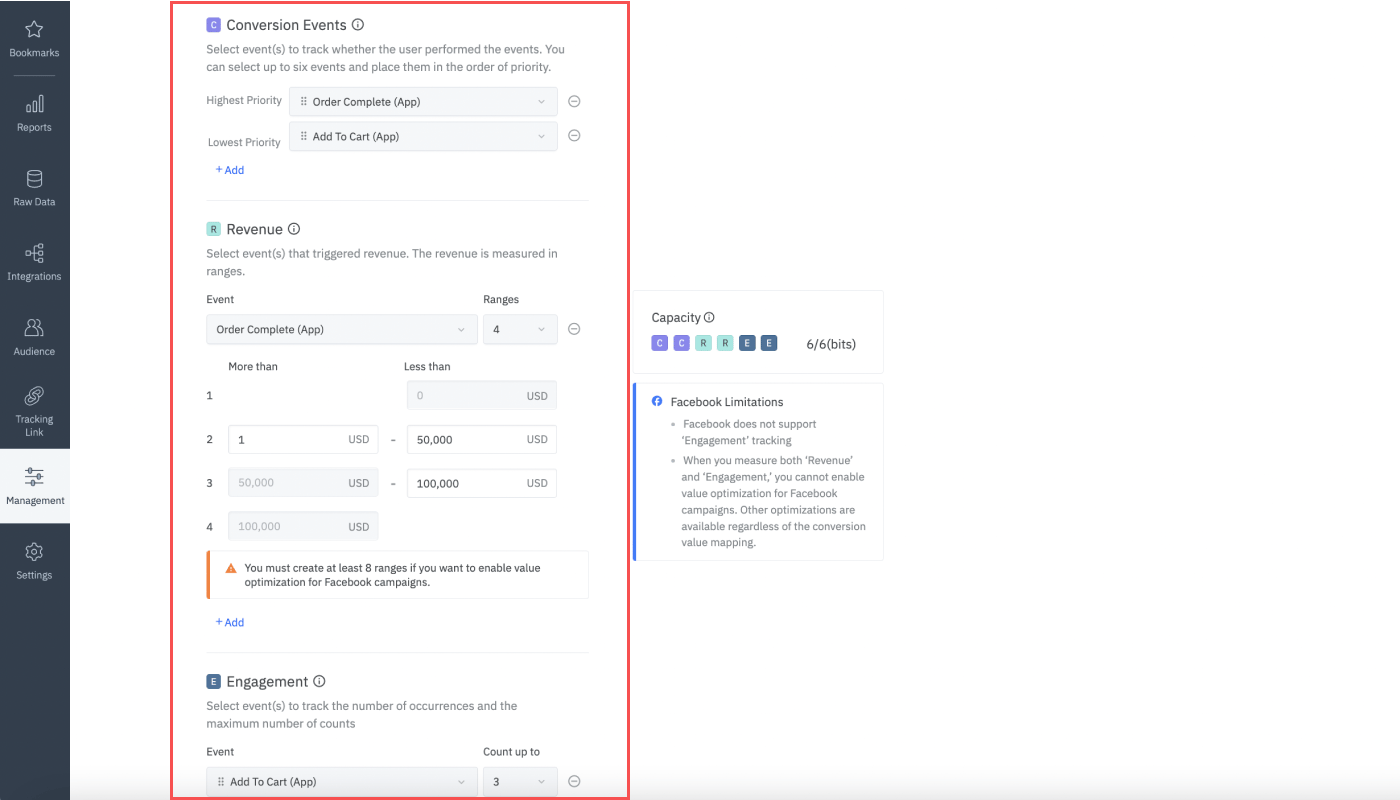
Conversion Value Mapping
After you finish setting the conversion values and click the “Save” button, the “See mapping” button is activated. When clicking that button, you can see how the selected events and event properties are assigned to the conversion values in the order of priority. The 6-bit binary numbers are converted to decimal numbers of 0 to 63. The conversion values are listed in the order of priority. For example, when you use all 6 bits for setting the conversion value rules, the first conversion value you see in the list is 63. When you use only 1 bit, the conversion value you see is 1 and 0.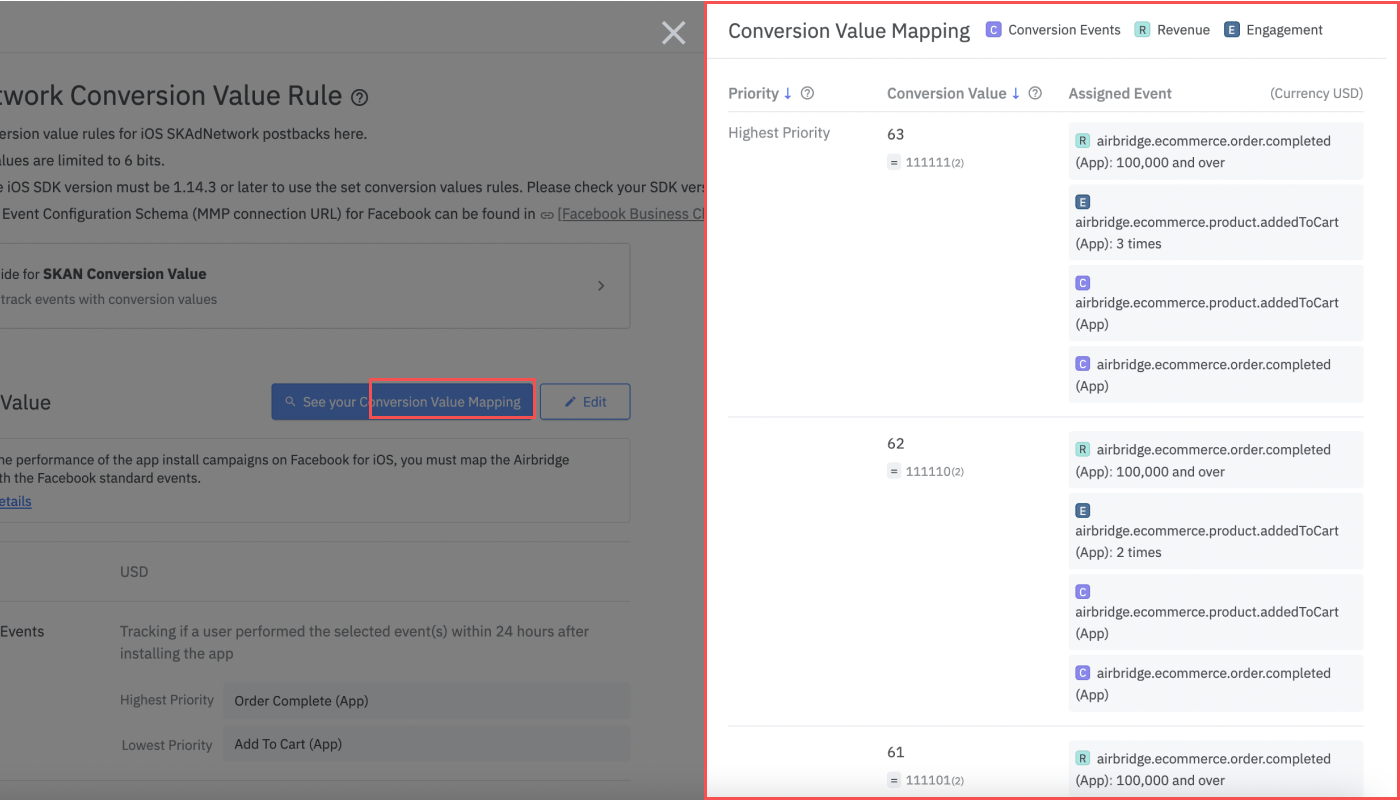
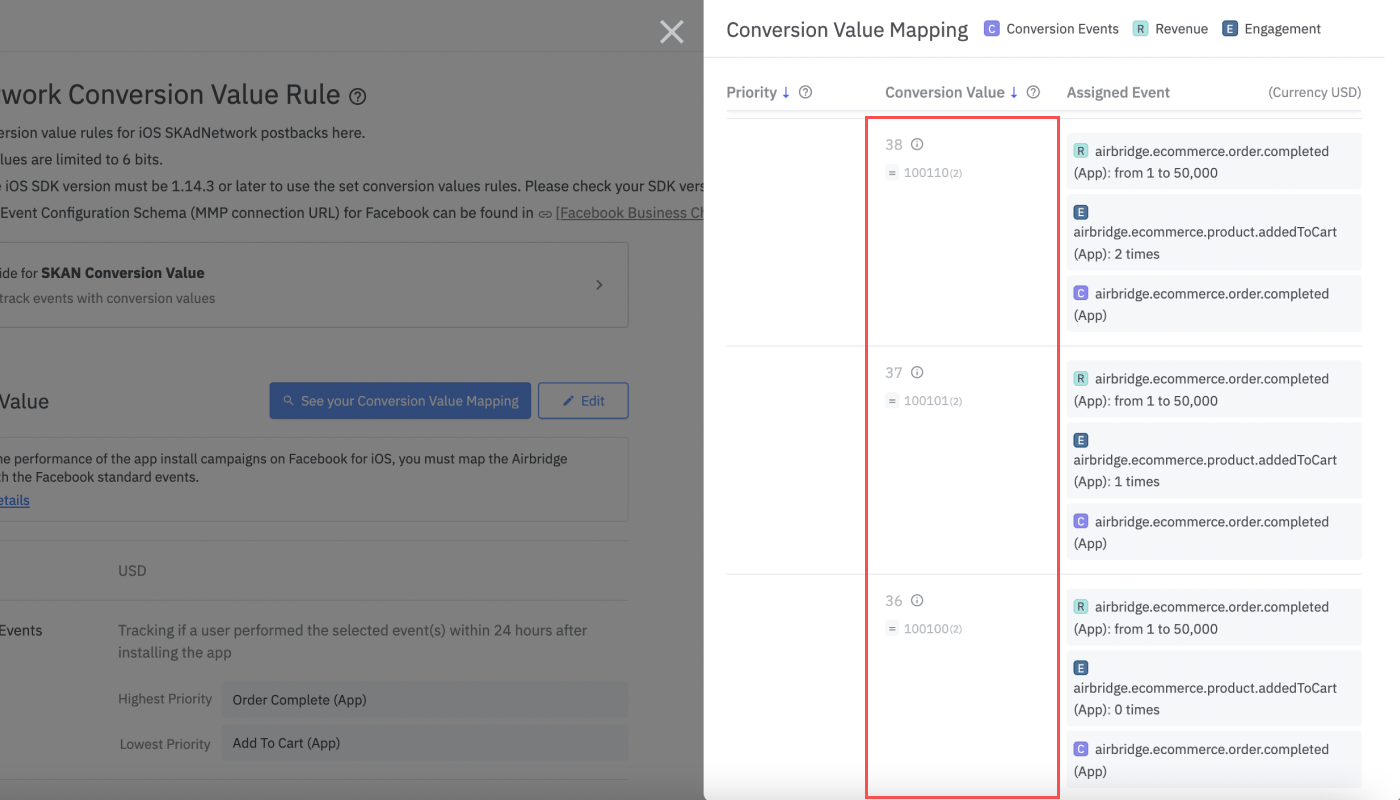
Edit your conversion value mapping
If you want to change the conversion value mapping, click the “Edit” button with the [pen] icon and change the conversion value rules. The changed rules are applied to users who install the app after the rules are changed. The changed rules are also applied to the data that have not been converted to conversion values yet. For example, even if a user installed the app before the conversion value rules were changed, the changed rules are applied to the data of that user when the ad network sends the postback after the conversion value rules are changed.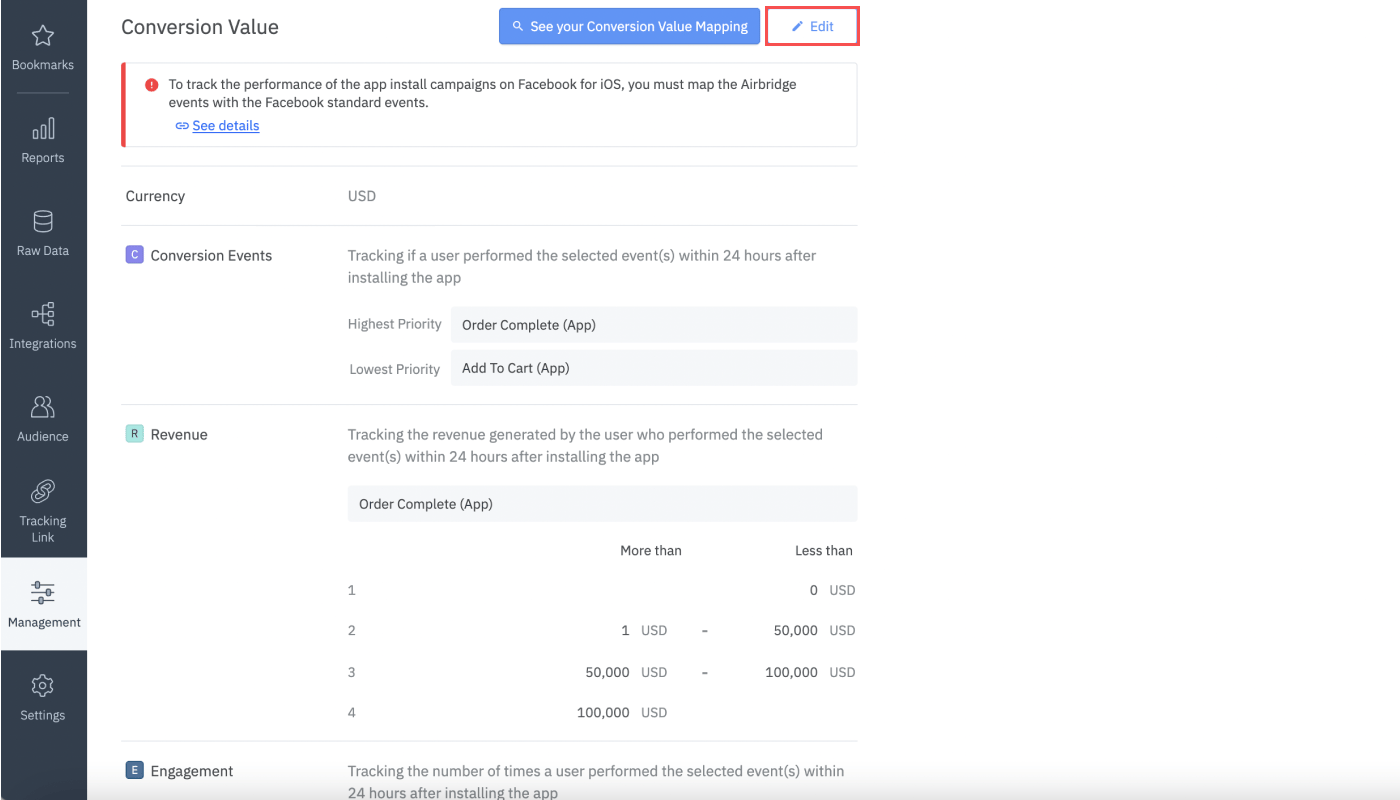
Priorities
Priorities refer to the order of the selected measurement components, events, and event properties assigned to the conversion values. You can change the priority level by dragging the measurement component cards. You can also change the priority level among the events within a measurement component by dragging the event cards.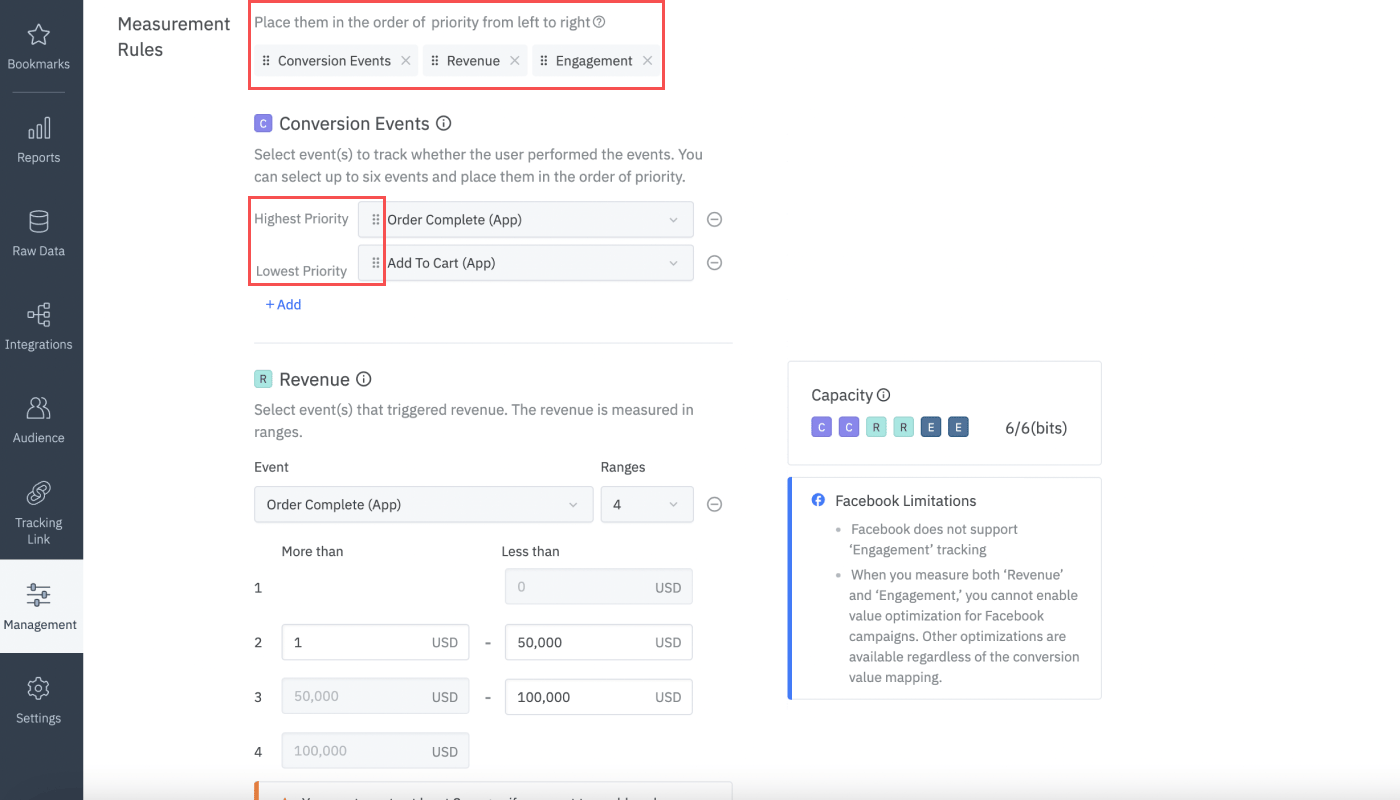
Facebook SKAN IntegrationThe priority setting is used for campaign optimization in Facebook Business (Meta). Facebook Business uses the conversion value with the highest priority to optimize campaigns. Therefore, the measurement component, event, and event property set with the highest priority are the most influential elements used for campaign optimization.If you want to use the SKAN conversion value rules you created in Airbridge for Facebook SKAN integration, a few settings must be completed in Airbridge and your Facebook Business dashboard. The Airbridge events selected for setting the conversion value rules must be mapped to the Facebook standard events, and the Airbridge event configuration schema URL must be copied to Facebook Business. However, if you want to track only app install events, these actions are unnecessary to take.To learn more about the integration, go to the Facebook SKAdNetwork integration user guide.
How to view data
SKAN data can be viewed in the Actuals Report. The conversion value is finalized 48 hours after the app install and the postback is sent randomly between 24 hours to 48 hours post-install to the ad channel that contributed to the install which is then forwarded to Airbridge. If 48 hours have not passed after the user installed the app, and Airbridge did not receive any postback, the SKAN data of that user cannot be viewed in the Actuals Report.Data updates from Facebook and GoogleFacebook and Google send the SKAN event data collected for the last five days through an update once a day. Therefore, there may be discrepancies in the SKAN campaign data among Facebook Business (Meta), Google Ads, and Airbridge dashboards.
Metrics
The SKAN metrics for standard events are available by default. The SKAN metrics for custom events are created when Airbridge gets postbacks of the custom events selected on the [SKAN Conversion Value] page. Search for “SKAN” in the GroupBy drop-down list to find the SKAN metrics in the Actuals Report.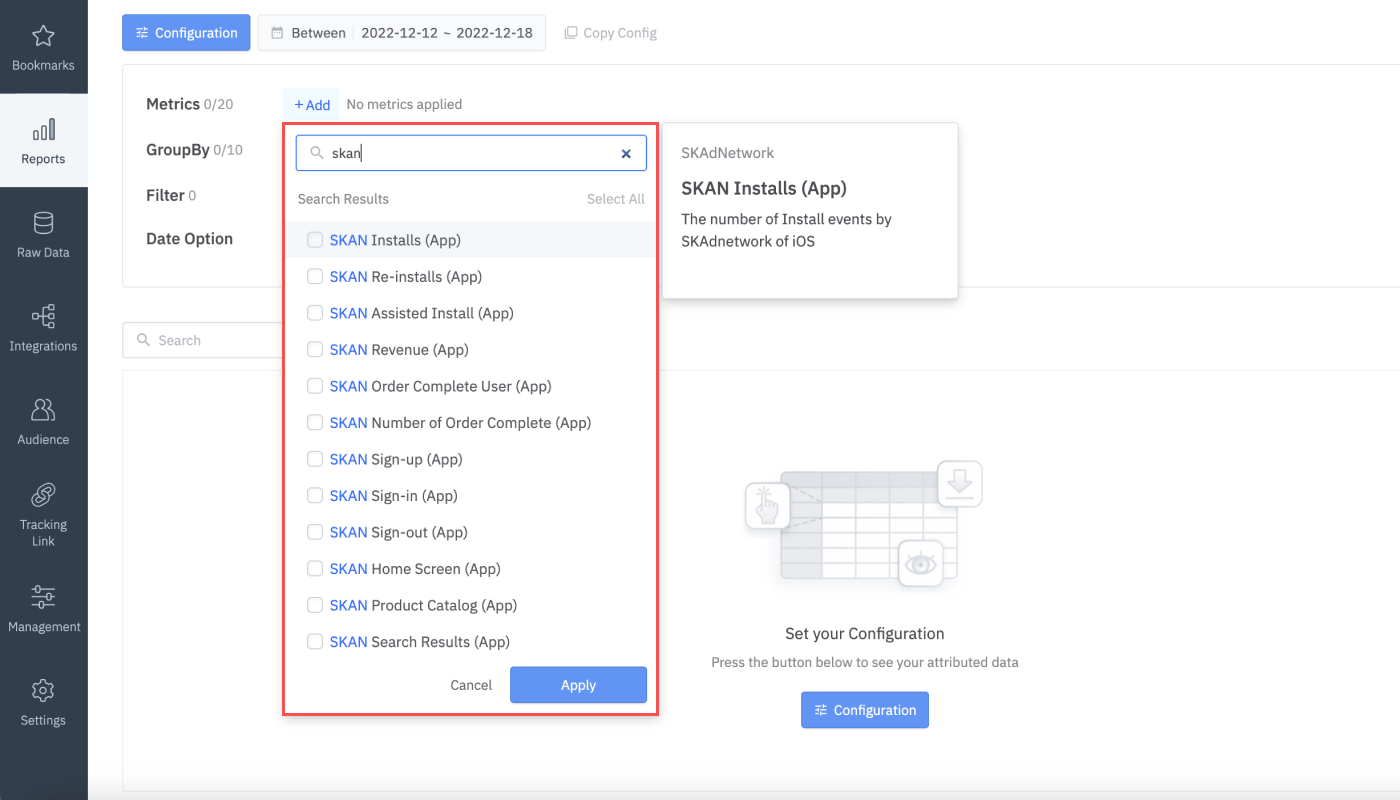
Conversion Events
When you select events under “Conversion Events,” the SKAN metrics are created in the form of “SKAN {event name} Users (App).” With these metrics, you can view the number of users acquired during the analysis period.Installs (App) and Re-installs (App)“Installs (App)” is the metric that shows the number of all installs tracked via SKAN. “Re-installs (App)” is the metric that shows the number of re-installs and does not show the number of new installs. The “Installs (App)” data always includes in the “Re-Installs (App)” data.
Revenue
When you select events under “Revenue,” the SKAN metrics are created in the form of “SKAN {event name} Revenue (App).” These metrics show the revenue using the median value of the revenue ranges. For the revenue that falls in the last revenue range where no median value is available, the minimum value is used. The formula below shows how the revenue value of each revenue range is calculated.- Revenue value measured in each of the revenue ranges = Median value of the revenue range X Number of events performed by users who generated the revenue amount falling in the revenue range
CautionThe revenue metrics use the median and minimum value of each revenue range and therefore do not show the actual revenue generated by the users. The discrepancy grows as the number of events that generate revenue increases. If you want to get revenue data via SKAN that is closer to the actual data, create more revenue ranges in smaller sizes.
Engagement
When you select events under “Engagement,” the SKAN metrics are created in the form of “SKAN {event name} Count (App).” With these metrics, you can view the sum of the number of occurrences of the selected events. The number of times a user performs the event cannot exceed the set maximum number for counting the occurrence of the selected event. For example, when you choose 3 for counting the occurrence of the selected event, and if users A, B, and C performed the event 1, 2, and 4 times respectively, you will see “6” as the “SKAN {event name} Count (App)” value, which is the result of “1+2+3.” Even though User C performed the event 4 times, the number of times User C performed the event is counted as 3.GroupBys
The GroupBy options under “SKAdNetwork” category can be used to view SKAN event data in detail, but they cannot be selected as Filter options. See the GroupBy options you can select to view SKAN data in the following table. Some options are not available to certain ad network data.
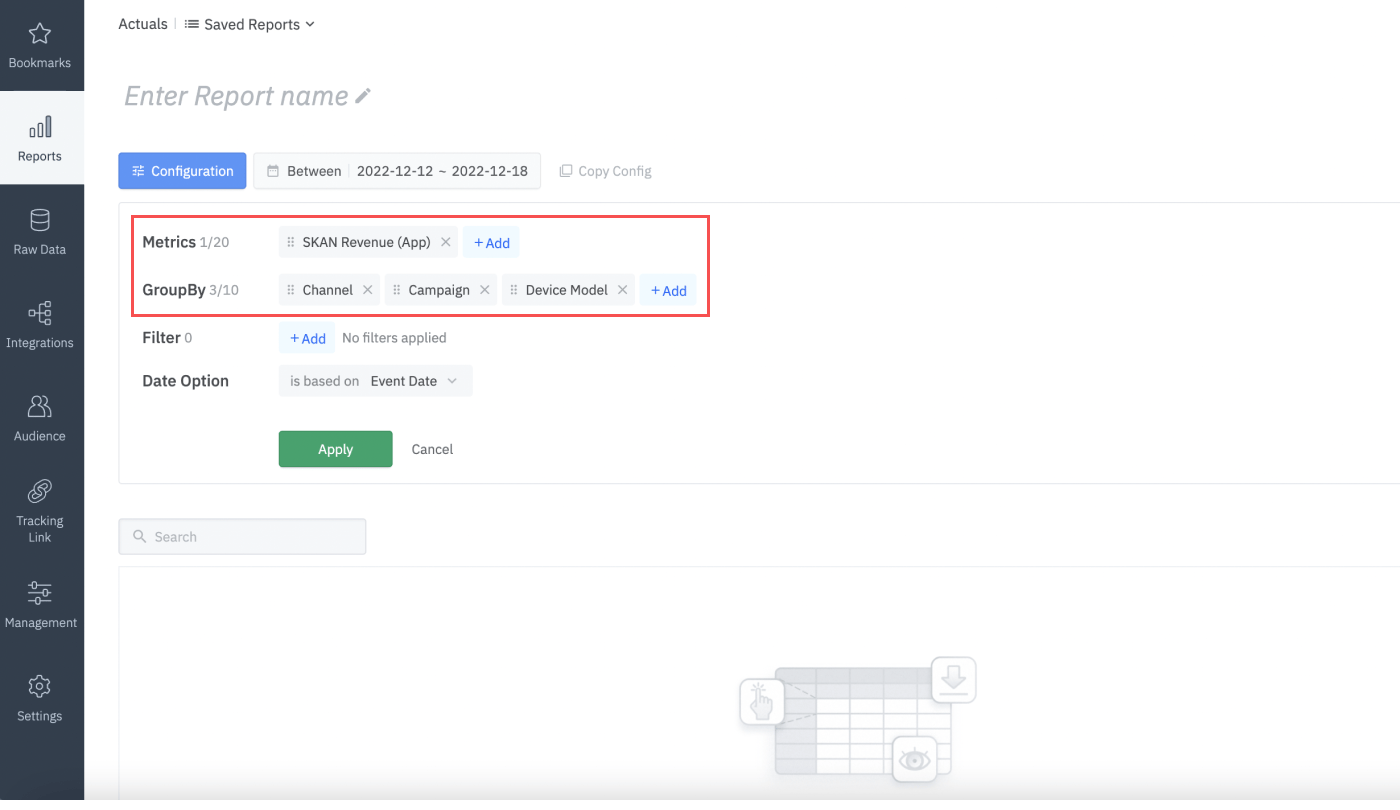
If you select the metric and the GroupBy like the image below, you can view the SKAN data by channel, campaign, and device model name.
Notes
Use S2S events for SKAN conversion values
Use S2S events for SKAN conversion values
To reflect events collected via server-to-server (S2S) in SKAN conversion values, make sure all of the following are met:
- Your Airbridge iOS SDK is version 4.8.0 or higher. We recommend version 4.8.1 or higher.
- The
calculateSKAdNetworkByServerEnabledoption is set totruein the Airbridge SDK. For details, see the iOS SDK documentation.