- Marketers Guide
- Reporting
- Funnel Analysis
Funnel Analysis
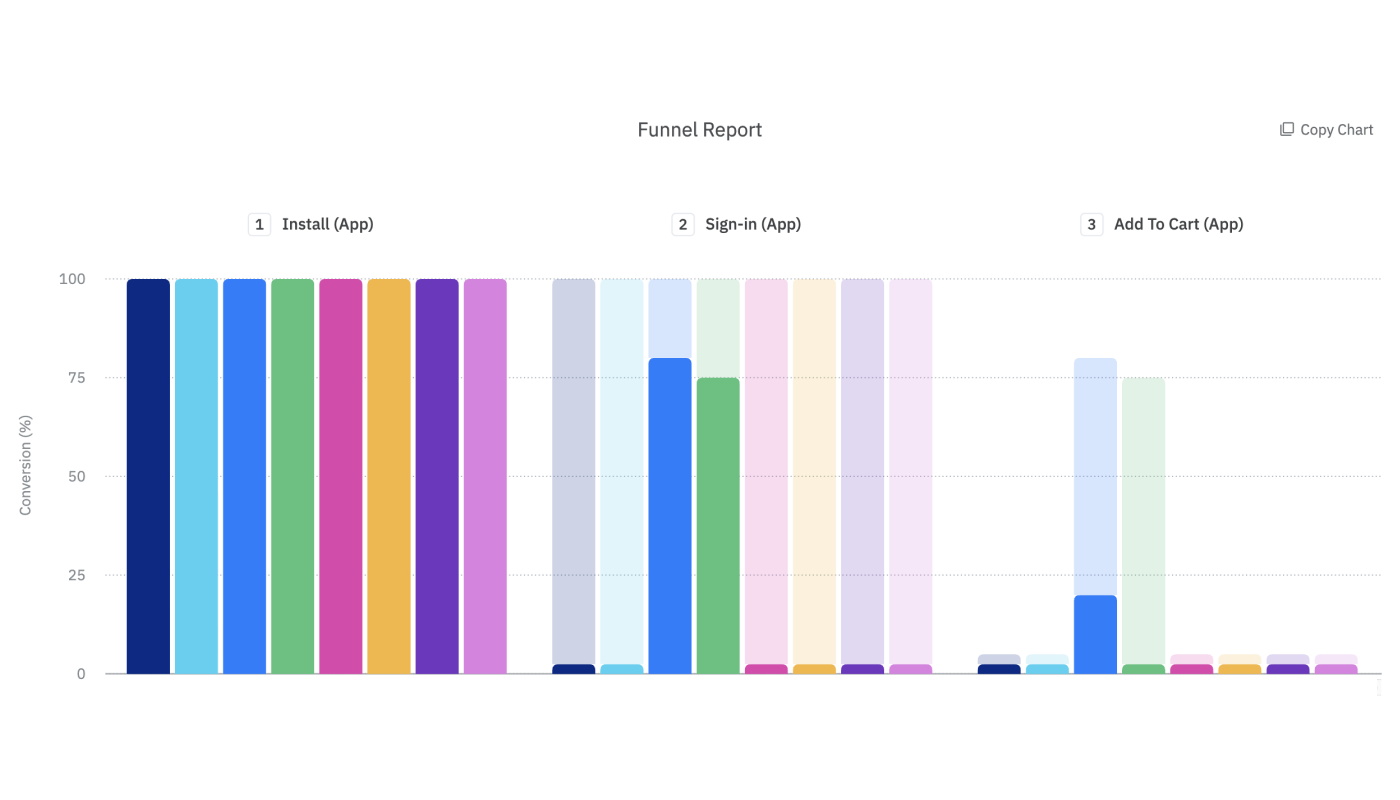
A funnel is defined by a series of events a user performs as part of the user journey. Funnel analysis helps you identify many facets of the user journey, from where users drop off to which user segment converts the most. The Airbridge Funnel Report visualizes the user journey in charts and tables, allowing for an easy grasp of actionable insights that fuel better decision-making in a timely manner.

The Funnel Report may give you answers to the following questions:
Are users who recently installed the app using feature X?
How long does it take for users to complete the funnel from install to payment?
At what step do users usually drop off?
What is the conversion rate for the past 7 days?
The Airbridge Funnel Report provides detailed analysis across the entire user journey from ad impression to in-app event engagement, using the exclusive data that Meta and Google share with their partners only.
The Funnel Report provides the conversion rate, number of converted users, and average conversion time by setting up a user cohort and funnel steps. With the Funnel Report, you will be able to understand when users tend to drop off and how the user journey varies by country or platform.
If you are new to funnel analysis, read the guide below and follow the simple steps to build your first Funnel Report.
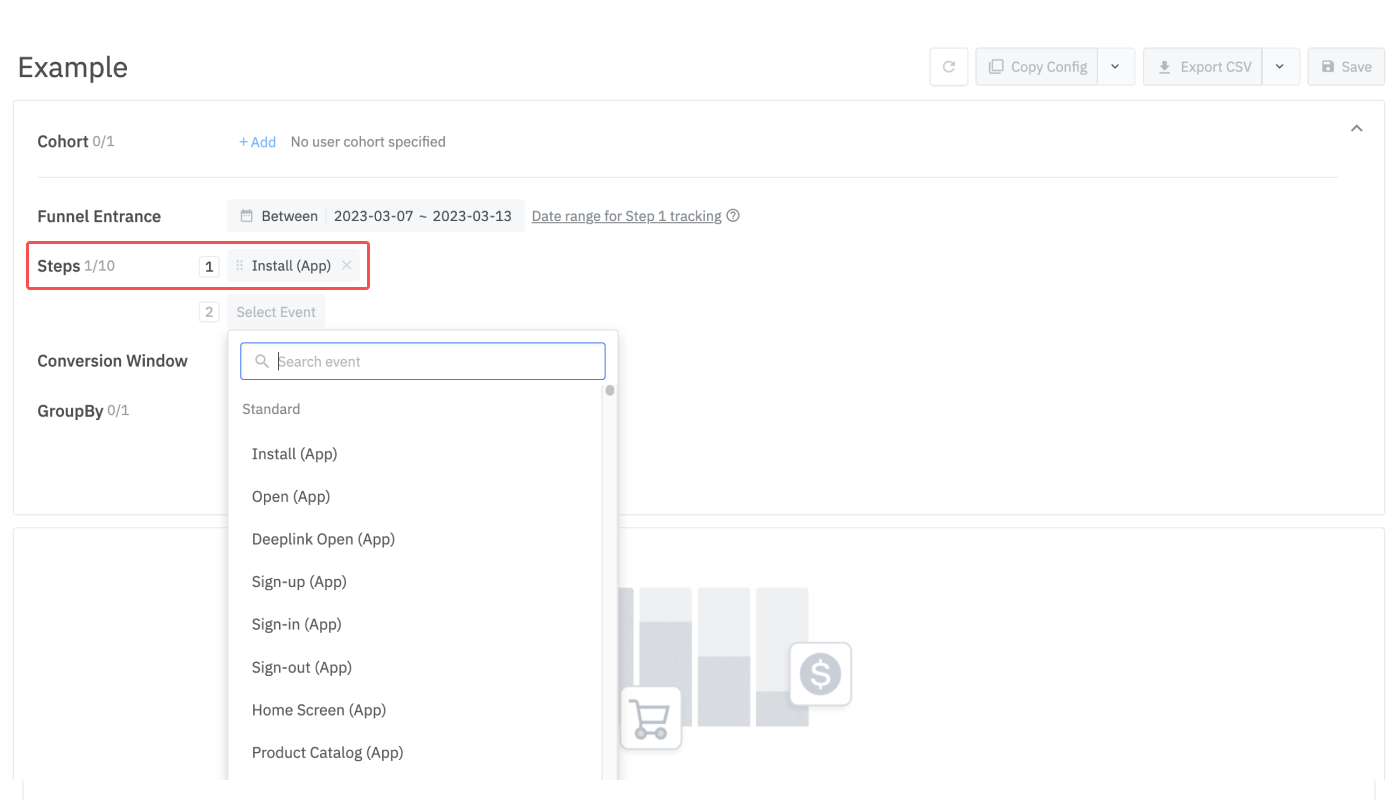
In the Funnel Report, you select events as steps. All Airbridge events, including Custom Events, can be set as steps.

Was this helpful?