Creating a Retention Report
The Retention Report shows how many users returned to the app within a certain number of days after installing or opening the app through a deep link. You can use the Retention Report to identify which channels and campaigns are most effective in attracting active app users and to optimize campaigns for better performance.
Only Owners and In-house Marketers have access to the Retention Report, which is available in [Reports]>[Retention].
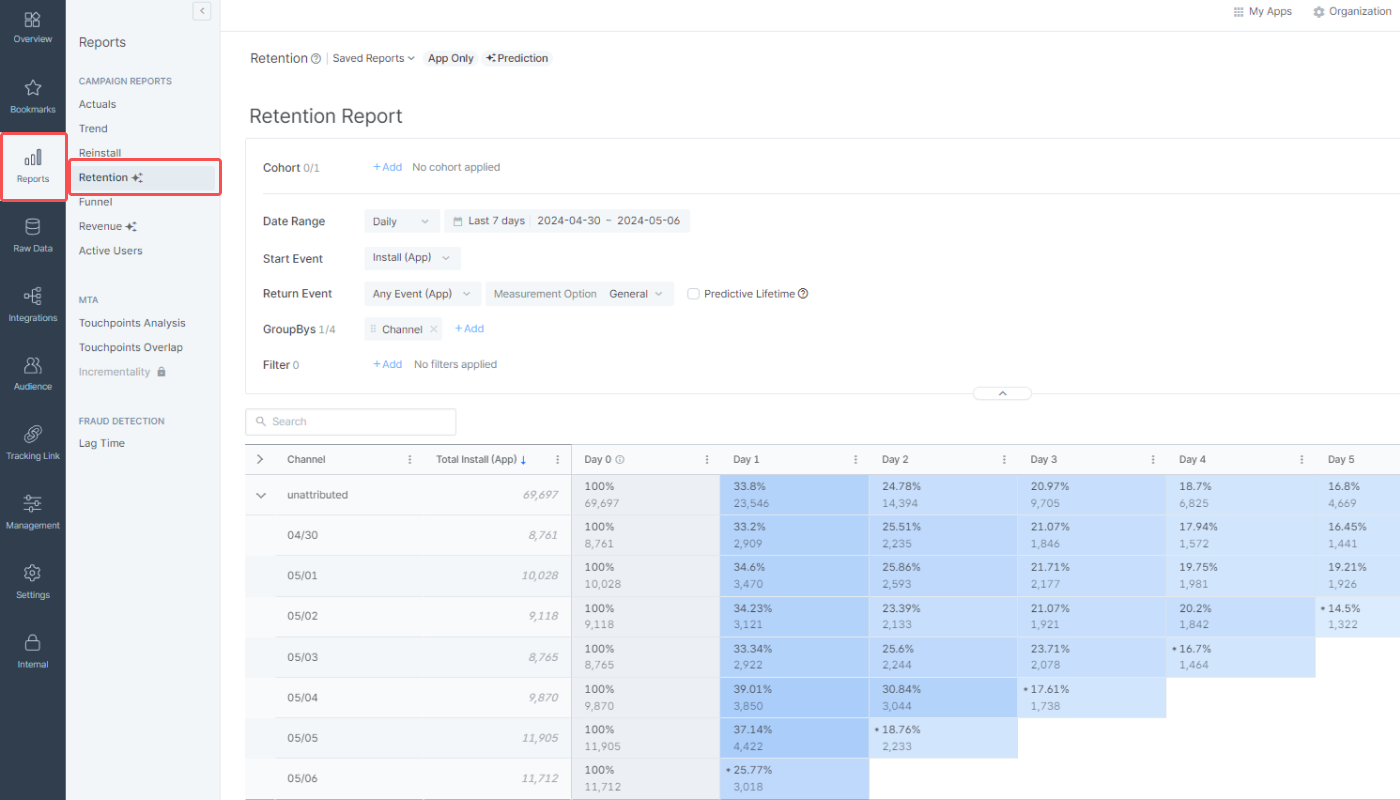
The configuration box offers options for configuring the cohort, granularity, date range, Start Event, Return Event, GroupBy, and filter to create a customized report view that suits your needs.
Configuring a cohort in the Retention Report allows you to analyze the retention of a specific user segment. The cohort configuration is optional. Click Add to configure a cohort.
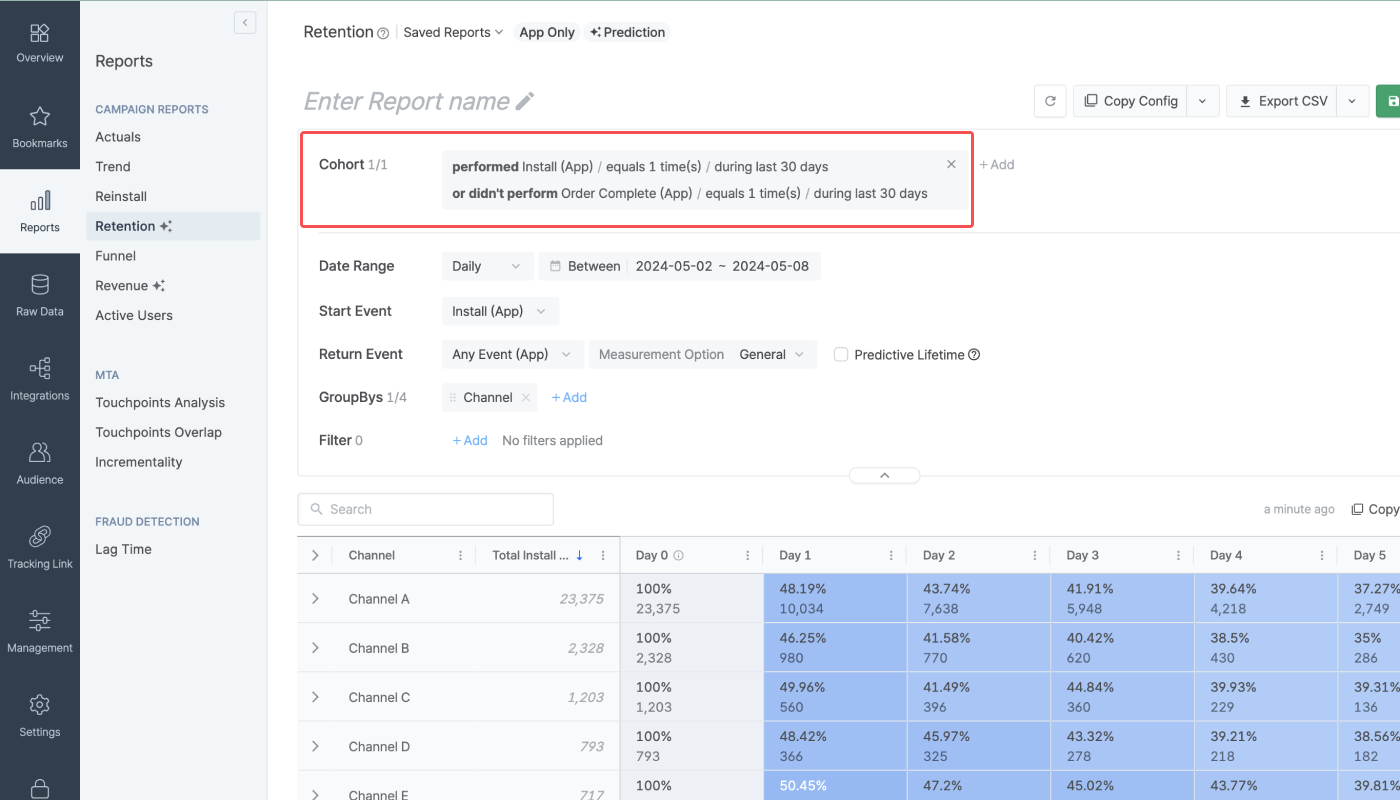
Read on to learn how to set up a cohort by configuring condition clauses.
Operator |
Description |
Option |
|---|---|---|
performed event | - Users who performed an event | App events |
didn't perform event | - Users who didn’t perform an event | App events |
where (had property) | - Non-event-related property of the users - Multiple properties can be added with “and” by clicking “+had property” | Property and value |
- Number of events performed by users | - Number of events performed by users | - equals - more than or equals - more than - less than or equals - less than |
when | - Time period the users performed the event - Can be set to max. 90 days - When using “between,” you can select from 2023-02-01 onwards - When using “during last,” you can decide whether to include “Today” or not | - during last - between - since |
You can use the following operators to add multiple condition clauses for a cohort.
Operator | Description |
|---|---|
or | Users who meet the aforementioned condition clause or the condition clause that follows |
and also | Users who meet the aforementioned condition clause and also meet the condition clause that follows |
and not also | Users who meet the aforementioned conditions but do not meet the condition that follows |
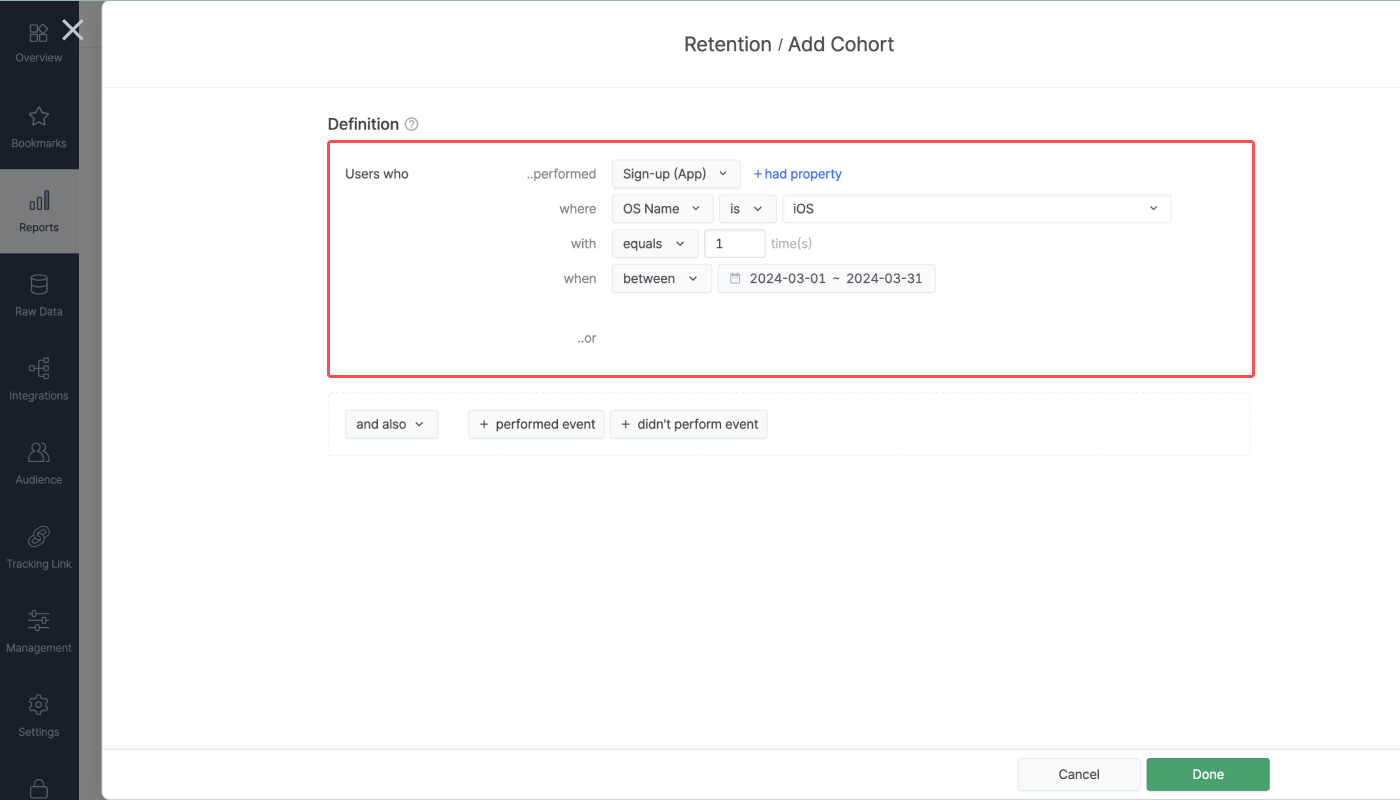
Let’s say you want to define a cohort as a group of iOS users who signed up for your service in March 2024. In that case, you may configure the cohort like in the image below.
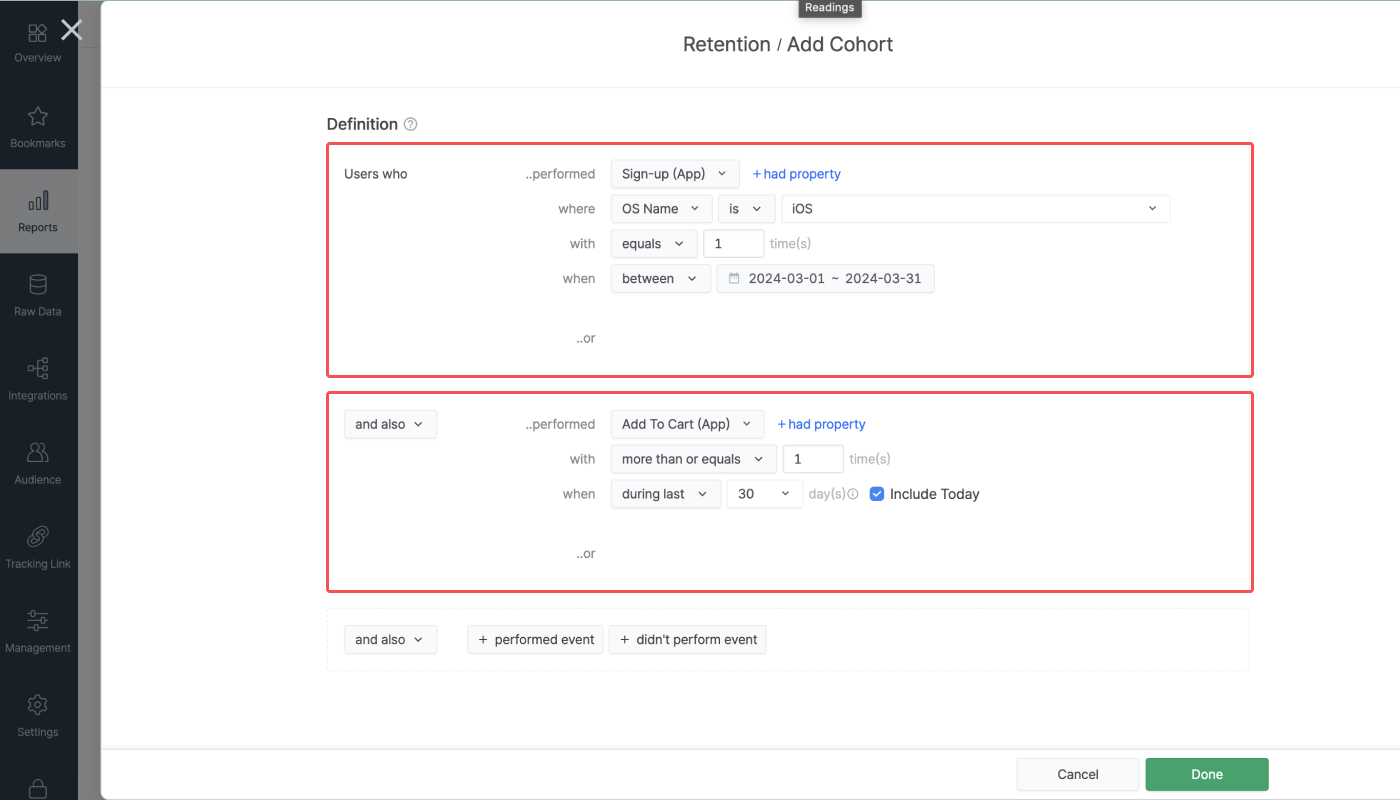
Let’s say you want to define a cohort as a group of iOS users who signed up for your service in March 2024 and also added an item to the cart at least once during the last 30 days, including today. In that case, you may configure the cohort like in the image below.
The Retention Report displays the data in different time intervals depending on the granularity option selected in the configuration box. The options include Minutely, Hourly, Daily, Weekly, and Monthly. Each option comes with a maximum number of intervals that can be displayed in the report. Each time interval is based on the Airbridge App Timezone.
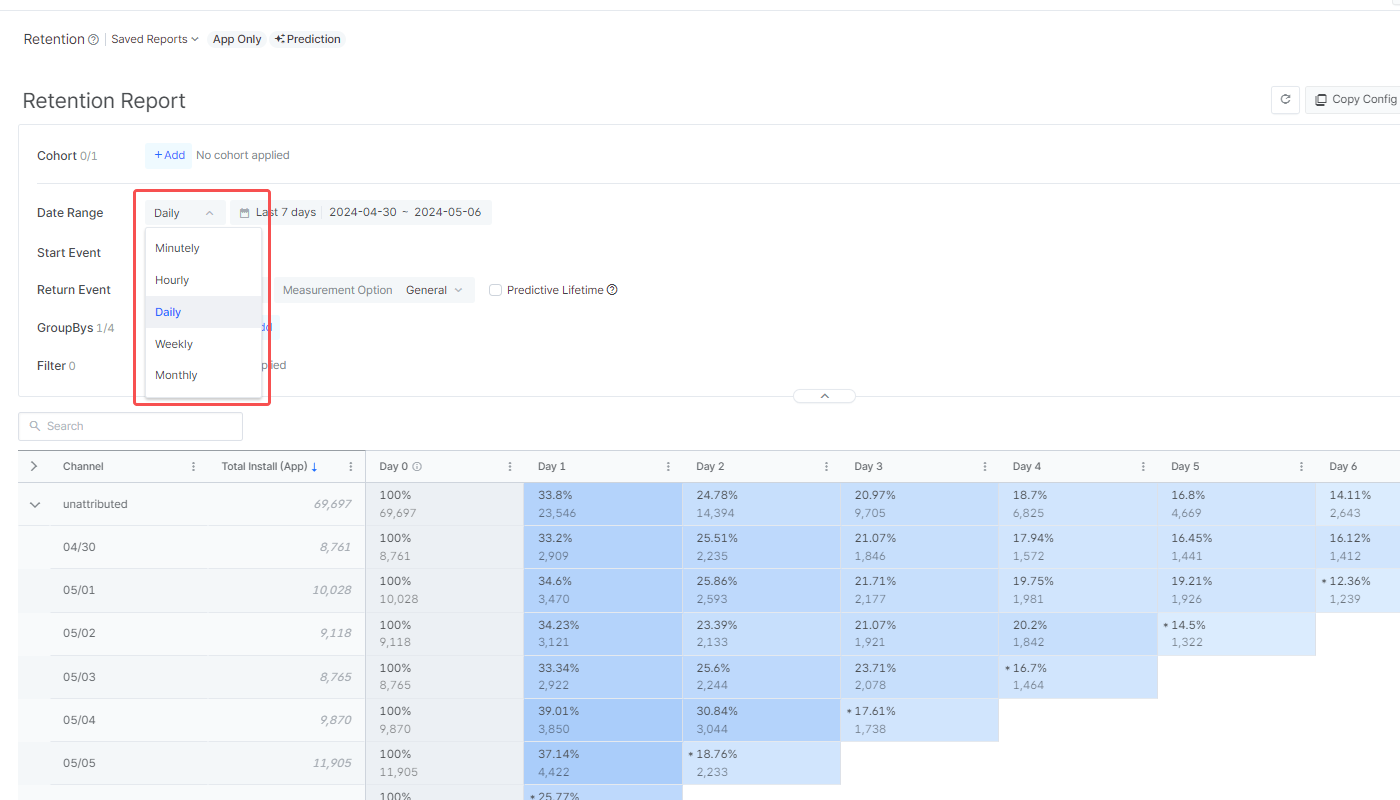
The number of intervals displayed in the Retention Report depends on the set date range. For more details, refer to the information below.
The following table indicates the maximum number of intervals that can show the retention data by granularity. The number of intervals displayed in the Retention Report depends on the set date range.
Note that no sub-rows are provided when the granularity is set to "Minutely" or "Hourly"; instead, the sum is displayed.
Granularity |
Maximum No. of Intervals |
|---|---|
Minutely | 60 Intervals (Minute 0 ~ Minute 59) |
Hourly | 24 Intervals (Hour 0 ~ Hour 23) |
Daily | 181 Intervals (Day 0 ~ Day 180) |
Weekly | 53 Intervals (Week 0 ~ Week 52) |
Monthly | 37 Intervals (Month 0 ~ Month 36) |
The number of intervals displayed in the Retention Report depends on the set date range.
Let's say today is 2024-05-07, and you have configured the Retention Report as follows.
Granularity and Date Range: Daily, From 2024-05-01 to 2024-05-07
The Retention Report will show 7 intervals, from Day 0 to Day 6, and the sub-rows will show the daily retention data from 2024-05-01 to 2024-05-07, as in the image below.
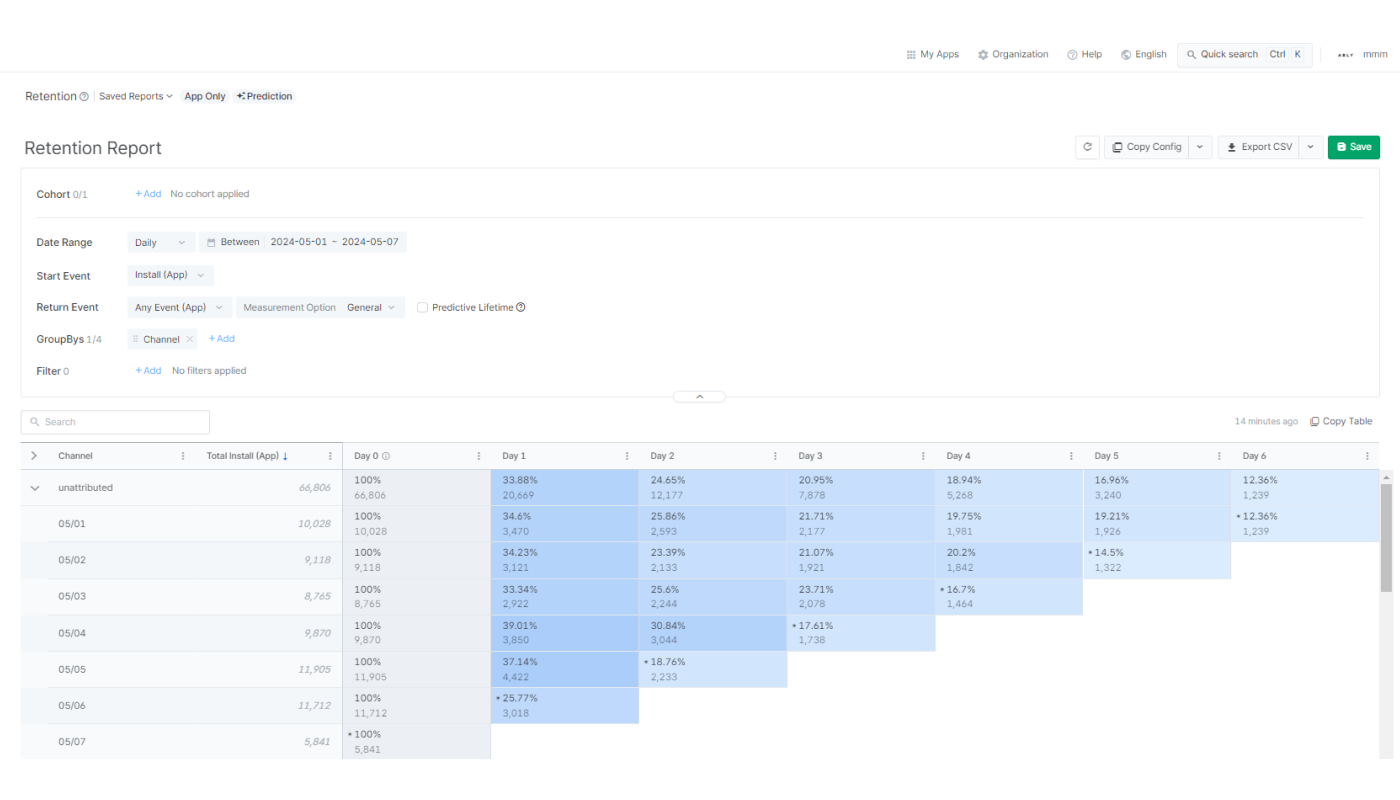
The number of intervals in the Retention Report changes when the set date range is way back in the past.
Let's say today is 2024-05-07, and you have configured the Retention Report as follows.
Granularity and Date Range: Daily, From 2024-04-01 to 2024-04-07
The Retention Report will show 31 intervals from Day 0 to Day 30, and the sub-rows will show the daily retention data from 2024-04-01 to 2024-04-07, as in the image below.
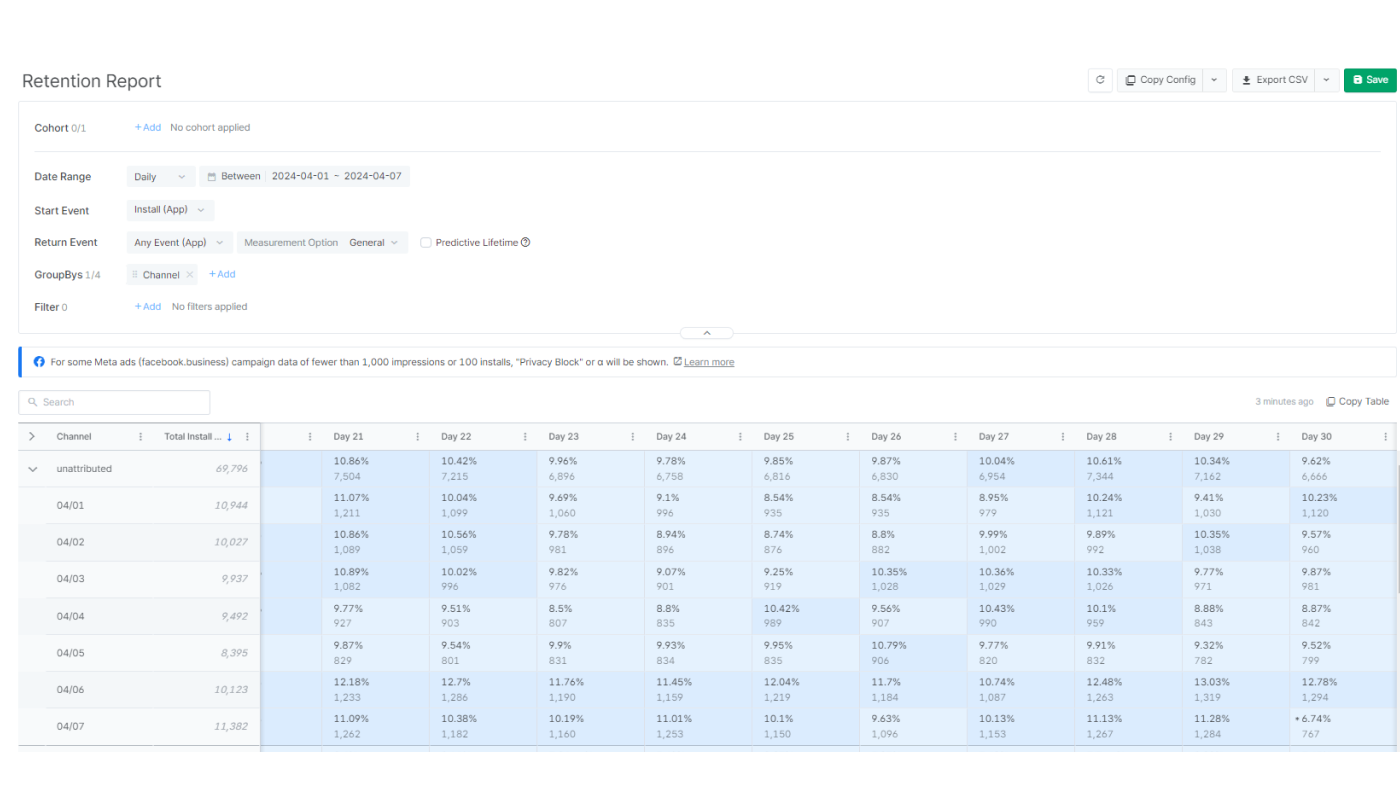
Attention
Event data older than 180 days from the day of report creation will be displayed as Unattributed for Google Ads (google.adwords), Meta ads (facebook.business), and TikTok For Business (tiktok) to comply with their privacy policies.
The Retention Report aggregates the data of users who performed the set Start Event within the set date range to show the retention rate and the number of retained users in the set granularity. The maximum volume of data that can be aggregated for each granularity for a single report view is as follows.
Minutely: 3 days
Hourly: 7 days
Daily: 62 days
Weekly: 12 weeks
Monthly: 3 months
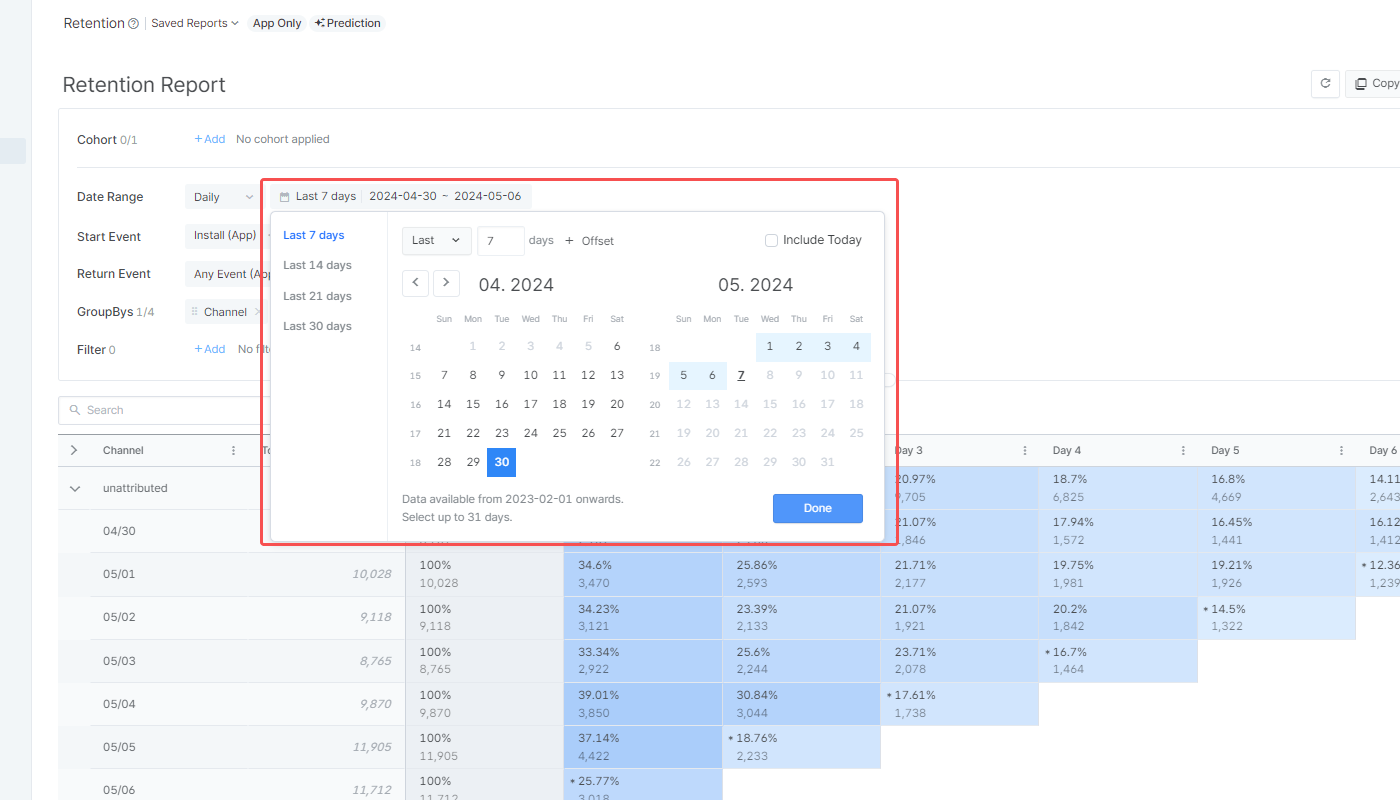
For more details about the date range settings, refer to the information below.
The date range can be set using the following conditions.
Condition | Date Range |
|---|---|
Between | From start date to end date |
Since | From start date to today |
Last | Last n days/weeks/months until yesterday |
When using “Last,” options such as “Include today,” “Include this month,” and “Offset” can be added.
For example, if you select Last 30 days and add Offset + 3 days, the date range will start 33 days before today and end 4 days before today.
The Retention Report offers the "Return On" or "Return On or After" as retention types to choose from.
Return On: Only users who performed a Return Event are counted as returning users in that specific interval.
Return On or After (Unbounded, Rolling): Users are counted as returning users in all intervals from the first interval to the last interval in which they performed a Return Event.
The number of retained users and the retention rate may be displayed differently based on the selected retention type. Read on to learn the difference.
Let’s say you have configured your Retention Report as follows.
Granularity: Daily
Start Event: Installs (App)
Return Event: Any Event (App)
Users A, B, and C installed your app on Day 0. The following table shows the events performed by the users.
User | Day 0 | Day 1 | Day 2 | Day 3 |
|---|---|---|---|---|
A | Installs (App) | Any Event (App) | Any Event (App) | Any Event (App) |
B | Installs (App) | No action | No action | No action |
C | Installs (App) | No action* | Any Event (App) | No action |
User A returned every day from Day 1 to Day 3, User B didn’t return at all, and User C returned only on Day 2.
Depending on the retention type you choose, the number of retained users and the retention rate for Day 1 will differ.
Number of retained users by retention type
Retention Type | Day 0 | Day 1 | Day 2 | Day 3 |
|---|---|---|---|---|
Return On | 3 | 1 | 2 | 1 |
Users A, B, C | User A | User A, C | User A | |
Return On or After | 3 | 2 | 2 | 1 |
Users A, B, C | User A, C | Users A, C | User A |
When you choose “Return On or After,” User C is included in the data points for Day 1 even though the user didn’t perform a Return Event on Day 1 because Day 2 is the last day the user returned. As a result, the number of retained users for Day 1 is 2, which includes User A and User C.
Retention rate by retention type
Retention Type | Day 0 | Day 1 | Day 2 | Day 3 |
|---|---|---|---|---|
Return On | 100% | 33% | 67% | 33% |
Return On or After | 100% | 67% | 67% | 33% |
The same applies to the retention rate of Day 1, where you can see a higher retention rate for “Return On or After” than “Return On.”
Data available in the Retention Report
The Retention Report only shows App event data; Web and iOS SKAdNetwork event data are not available.
The Retention Report aggregates users who performed the Start Event and Return Event to calculate the number of retained users and the retention rate. Refer to the information below to further understand the Start Event and Return Event in the Retention Report.
A Start Event is an event that is performed by the user who initiated the app engagement during the set date range. Data of users who didn't perform the Start Event will be excluded from the reporting. Options for Start Event differ depending on the granularity configured.
Daily, Weekly, Monthly: Install (App), Deeplink Open (App), Deeplink Pageview (App), Sign-up (App), Sign-in (App), Order Complete (App)
Minutely, Hourly: Install (App)
You can select multiple events as the Start Event. For example, if you select Daily as granularity and select Install (App) and Deeplink Open (App) as the Start Event, the Retention Report will report the retention of the users who performed the Install (App) and Deeplink Open (App) within the set date range.

If a user performs the Return Event after performing the Start Event, the user is determined to have returned to the app. If a user didn't perform a Return Event or performed the Uninstall (App) event, the user is determined not to have returned.
As a Return Event, you can select Standard Events or that have been collected at least once. If you select Any Event (App) as the Return Event, all users who perform any in-app event, except for the Uninstall (App) event, will be considered to have returned to the app.
You can select multiple Return Events. For example, if you select Add to Cart (App) and Product View (App) as Return Events, only users who add an item to the cart or open a product page are considered to have returned to the app.
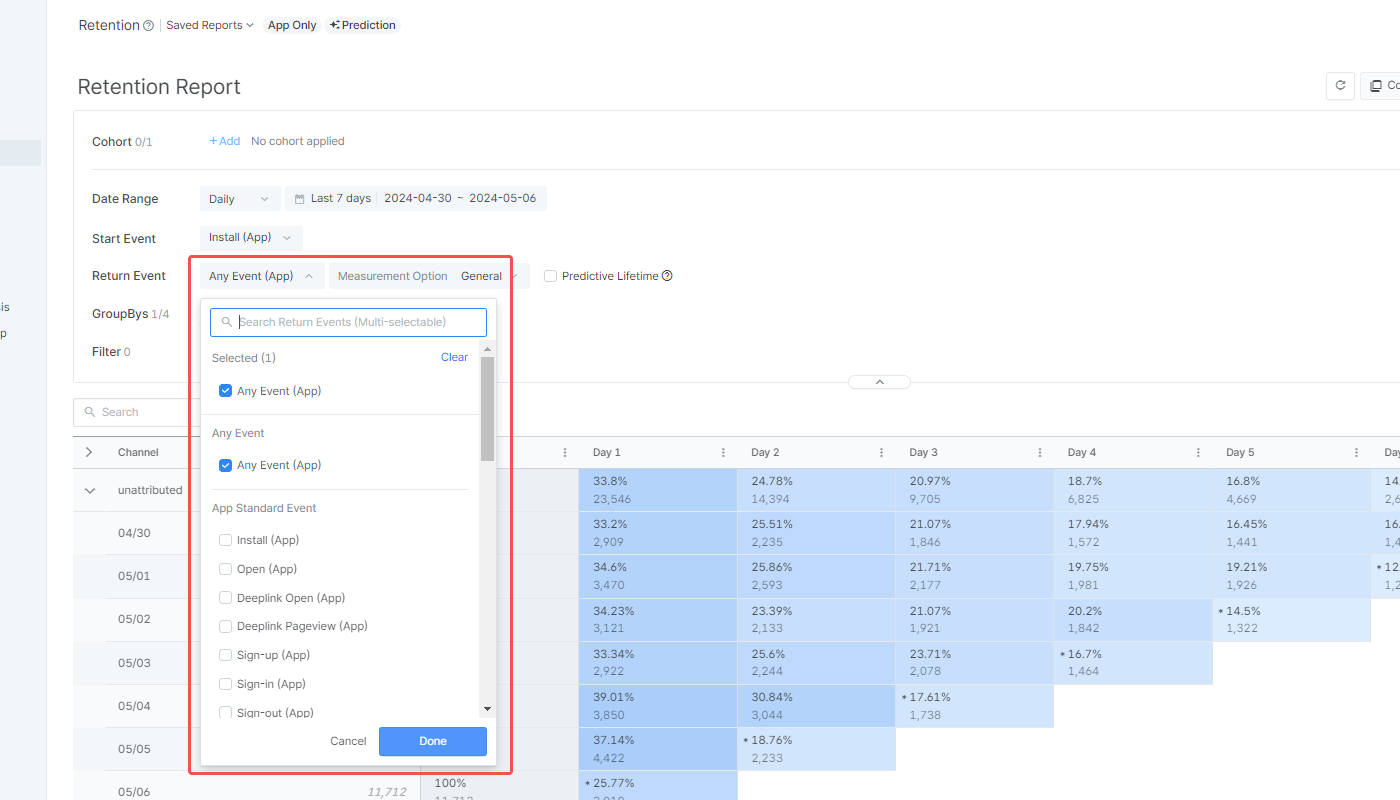
The Return Events are aggregated in different ranges depending on the chosen granularity.
When choosing "Minutely" as granularity, the ranges are provided from Minute 0 to Minute 59. When choosing "Hourly," the ranges are provided from Hour 0 to Hour 23.
When choosing "Daily," "Weekly," and "Monthly," the following options are available in the Day N selector for the Return Events to configure the number of ranges displayed in the Retention Report.
Daily: Max. Day 30, Max. Day 60, Max. Day 90, Max. Day 180
Weekly: Max. Week 4, Max. Week 12, Max. Week 24, Max. Week 52
Monthly: Max. Month 3, Max. Month 6, Max. Month 12, Max. Month 36
Let's say 5 users performed various app events from 2024-04-01 to 2024-04-03 as described in the following table.
User | 2024-04-01 | 2024-04-02 | 2024-04-03 |
|---|---|---|---|
User A | Install (App), | Deeplink Open (App) | Add To Cart (App) |
User B | Sign-up (App) | Add To Cart (App) | Order Complete (App) |
User C | Deeplink Open (App) | Deeplink Open (App), | Order Complete (App) |
User D | Install (App) | Add To Cart (App) | Deeplink Open (App) |
User E | Install (App), | Deeplink Open (App) | Add To Cart (App) |
Let's say the Retention Report has been configured like the following.
Granularity and date range: Daily, From 2024-04-01 to 2024-04-03
Start Event: Install (App), Deeplink Open (App)
Return Event: Deeplink Open (App), Order Complete (App)
In this case, User A, C, D, E performed the Start Event on 2024-04-01. Among them, User A and User C also performed the Return Event on the same day. As a result, the number of retained users and the retention rate of Day 0 (2024-04-01) is 2 and 50%.
Day 0 (2024-04-01) | Day 1 (2024-04-02) | Day 2 (2024-04-03) | |
|---|---|---|---|
4/1 (2024-04-01) | 2 (50%) | 3 (75%) | 2 (50%) |
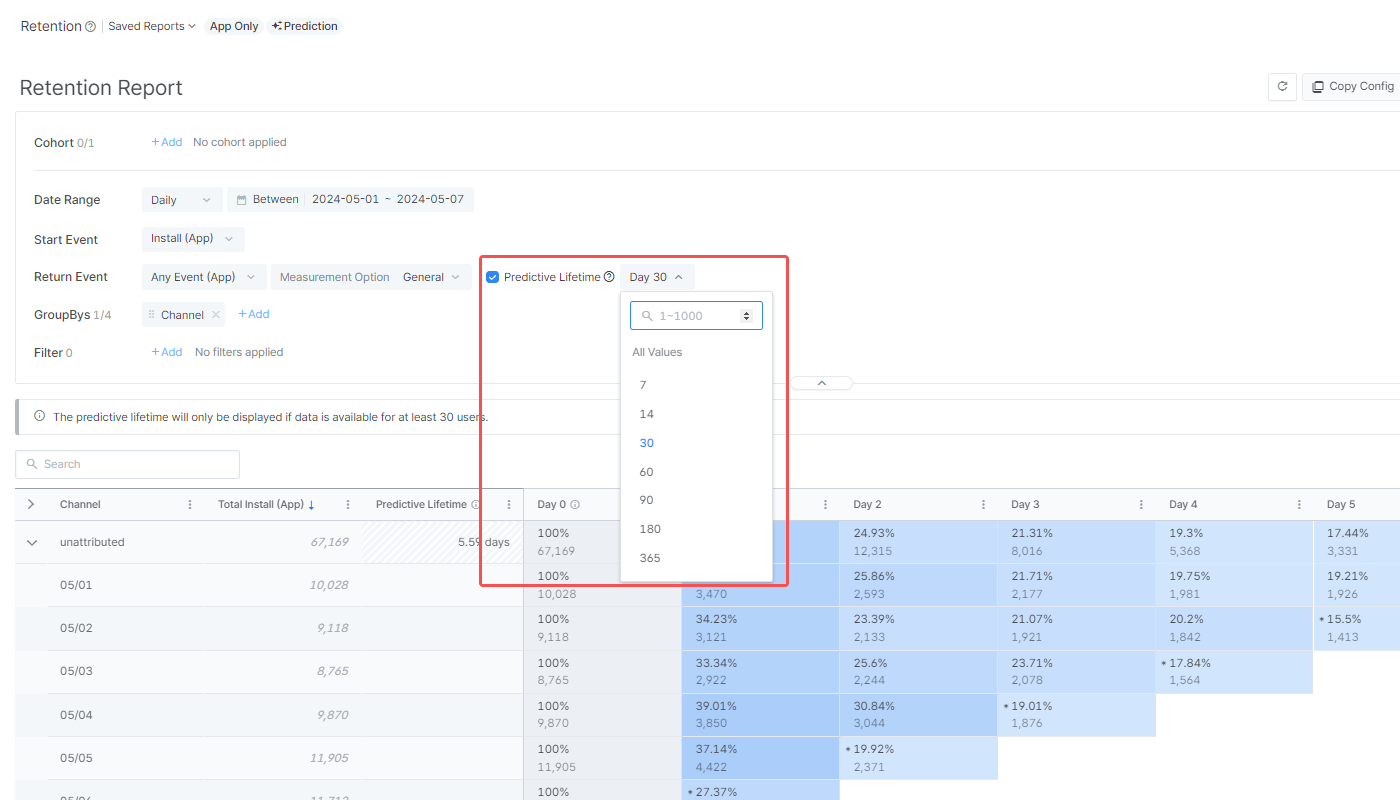
You can enable the predictive lifetime in the report by clicking the checkbox and selecting the calculation period from the drop-down menu. For more details about the predictive lifetime, refer to this article.
The Measurement Option feature allows you to determine the number of Start Events used to measure Return Events. If a user performs the Start Event multiple times within the set date range, the retention rate may vary depending on the Measurement Option.
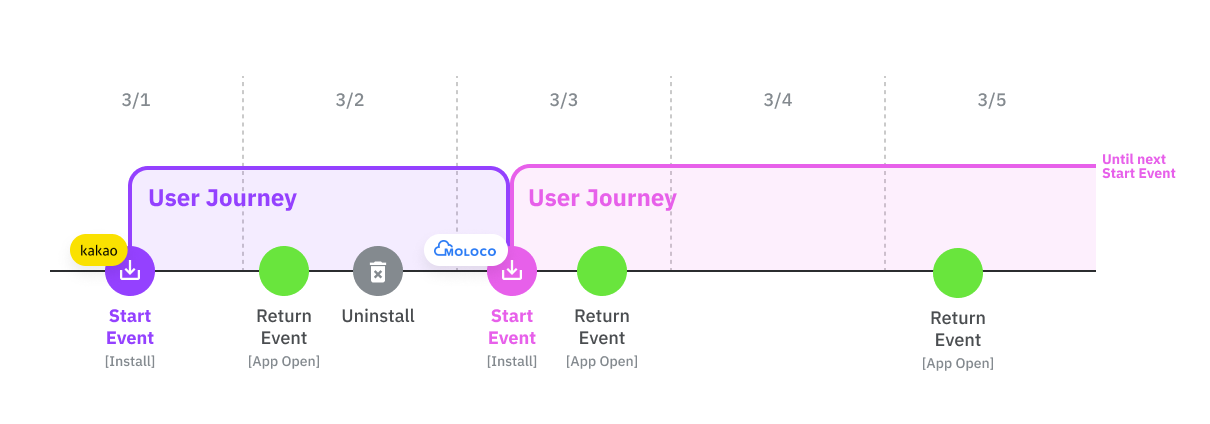
In General mode, the Return Events are aggregated based on all Start Events that occurred during the set date range to measure user retention. In Confined mode, user retention is measured with respect to a single Start Event. When a new Start Event occurs, the user journey that was initiated by the previous Start Event is no longer measured.
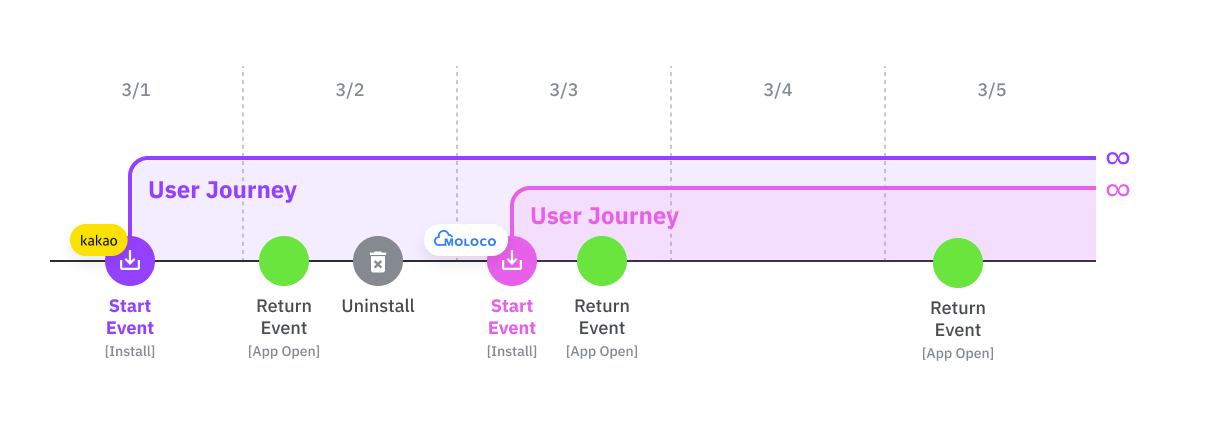
In General mode, user retention is measured based on all Start Events that occurred during the set date range. When a new Start Event occurs, the user journey initiated by the previous Start Event and the new user journey initiated by the new Start Event are both measured.
If a new Start Event occurs driven by a different ad from the ad that drove the previous Start Event, the subsequently occurring Return Events will be attributed to both ads.
In Confined mode, user retention is measured based on a single Start Event that occurred during the set date range. When a new Start Event occurs, the user journey initiated by the previous Start Event is no longer tracked, and the new user journey initiated by the new Start Event is tracked.
This means that all Return Events are attributed to the ad that drove the latest Start Event that initiated the user journey.
Refer to the example cases below to understand how the results differ by the Measurement Options.
Let's say a user installed your app on 2024-03-01 after engaging with a touchpoint in Channel X and uninstalled the app the next day. This user installed the app again on 2024-03-03 after engaging with a touchpoint in Channel Y and opened the app again on 2024-03-05.
Let's say the Retention Report has been configured as follows.
Granularity and date range: Daily, From 2024-03-01 to 2024-03-05
Start Event: Install (App)
Return Event: Any Event (App)
GroupBy: Channel
Depending on the Measurement Option, the results will vary as follows:
The Open (App) event performed on 2024-03-05 is attributed to both Channel X and Channel Y.
The Open (App) event is measured as the Return Event of Day 4 of the user journey initiated by the Start Event on 2024-03-01, which is attributed to Channel X.
The Open (App) event is also measured as the Return Event of Day 2 of the user journey initiated by the Start Event on 2024-03-03, which is attributed to Channel Y.
Refer to the table below.
Channel | Date | Total Installs | Day 0 | Day 1 | Day 2 | Day 3 | Day 4 |
|---|---|---|---|---|---|---|---|
Channel X | 3/1 | 1 | 1 | 1 | 1 | 0 | 1 |
| 3/2 | 0 | 0 | 0 | 0 | 0 |
|
| 3/3 | 0 | 0 | 0 | 0 |
|
|
| 3/4 | 0 | 0 | 0 |
|
|
|
| 3/5 | 0 | 0 |
|
|
|
|
Channel Y | 3/1 | 0 | 0 | 0 | 0 | 0 | 0 |
| 3/2 | 0 | 0 | 0 | 0 | 0 |
|
| 3/3 | 1 | 1 | 0 | 1 |
|
|
| 3/4 | 0 | 0 |
|
|
|
|
| 3/5 | 0 |
|
|
|
|
|
The Open (App) event performed on 2024-03-05 is attributed only to Channel Y. The user journey initiated by the Stat Event that occurred on 2024-03-01 is no longer tracked.
The Open (App) event is not attributed to Channel X.
The Open (App) event is measured as the Return Event of Day 2 of the user journey initiated by the Start Event on 2024-03-03, which is attributed to Channel Y.
Refer to the table below.
Channel | Date | Total Installs | Day 0 | Day 1 | Day 2 | Day 3 | Day 4 |
|---|---|---|---|---|---|---|---|
Channel X | 3/1 | 1 | 1 | 1 | 0 | 0 | 0 |
| 3/2 | 0 | 0 | 0 | 0 | 0 |
|
| 3/3 | 0 | 0 | 0 | 0 |
|
|
| 3/4 | 0 | 0 | 0 |
|
|
|
| 3/5 | 0 | 0 |
|
|
|
|
Channel Y | 3/1 | 0 | 0 | 0 | 0 | 0 | 0 |
| 3/2 | 0 | 0 | 0 | 0 | 0 |
|
| 3/3 | 1 | 1 | 0 | 1 |
|
|
| 3/4 | 0 | 0 |
|
|
|
|
| 3/5 | 0 |
|
|
|
|
|
Attention
All values displayed in the Revenue Report with the GroupBy and Filter options applied are based on users who performed the Start Event.
GroupBys are used to split the metric data into groups. Up to 6 GroupBys can be selected. The data are visible in the table from the left in the order of the configuration. Refer to this article to learn about the GroupBy options that are available.
Filters can be configured to display specific data in the chart and table. Select the filter option, operator, and value to configure a filter. Properties collected at least once are available as the filter option.
The Retention Report displays the number of retained users and the retention rate at the chosen granularity. For details about the metrics available in the Retention Report, refer to this article.
Note
Starting February 4, 2025, the Overview Dashboard, Actuals Report, Trend Report, Retention Report, Revenue Report, Active Users Report, and Audience Manager will only display events and metrics measurable using the collected data.
The user retention data is provided in table format. Each cell in the table shows the retention rate and the number of retained users calculated from when the user performed the Start Event after a certain number of intervals, based on the granularity you set. For example, the Day 3 retention rate is the retention rate 3 days after the user performed the Start Event.
When clicking the [expand] icon in the top row, the number of retained users and the retention rate visible in the sub-rows by date buckets. Click again to collapse the table and hide the sub-rows.
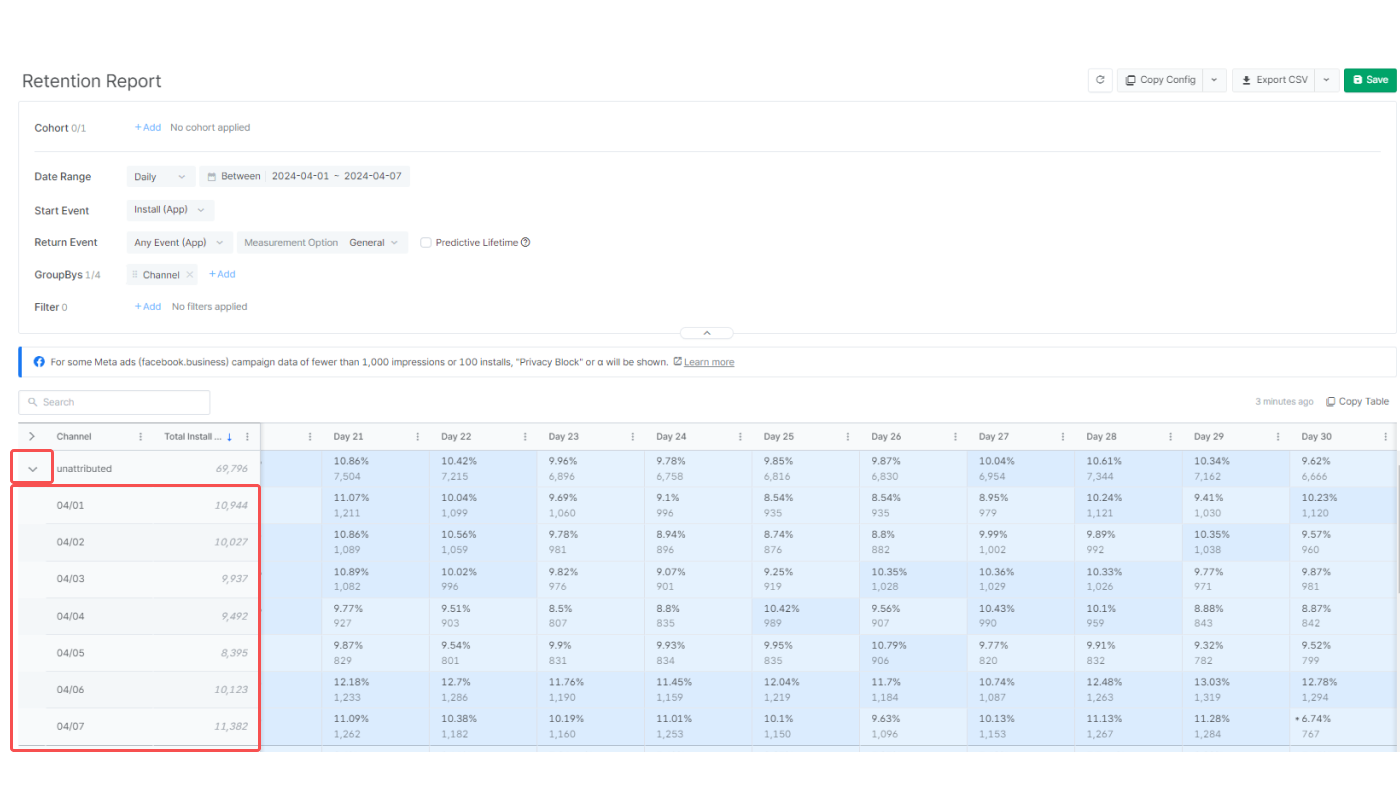
When the granularity is set to Hourly or Minutely, the [expand] icon won't show as the data is not provided in sub-rows by date buckets.

The calculation methods for retention metrics in the top and sub-rows differ. To learn more about the calculation methods, refer to this article.
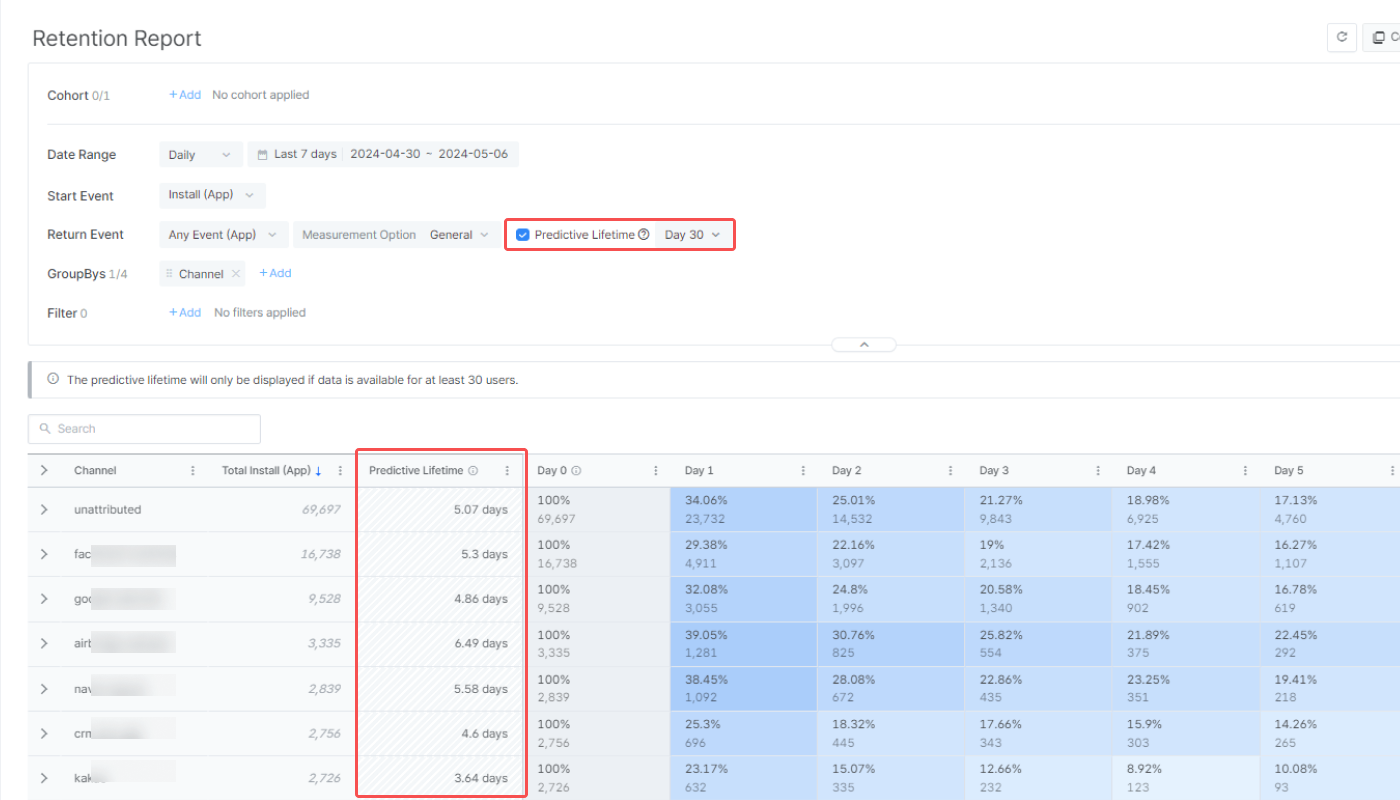
When the predictive lifetime feature is enabled, the data is visible in the table under the Predictive Lifetime column. For more details on predictive lifetime, refer to this article.
Airbridge reports support various features, from saving reports to sharing them with others.
The table shows the general features supported by Airbridge reports. Some features are not available in certain reports.
Feature |
Description |
|---|---|
Refresh | Reload data with the existing report configuration. The time passed since the time the data was loaded appears next to the Refresh button or Copy Table button. |
Wide controls | Configure the report on a wider panel. |
Search | Search the report by keywords. |
Expand/Collapse | Expand or collapse the configuration box. |
Report naming | Name the report and save it for later use. |
Refer to the table below to learn how to share your report with others.
Feature |
Description |
User Guide |
|---|---|---|
Copy Config | Click Copy Config to share the report with other Airbridge users regardless of their app roles and access settings. | |
Share Report URL | The Report URL is the URL assigned to each Airbridge report. By sharing the report URL with other Airbridge users with the same access level as yours, you can share the same report view. | |
Grant App Access | Invite users to the Airbridge App and assign app roles. The data users can access depends on their app roles. | |
Copy Table | Click Copy Table and paste the table into a spreadsheet or a messenger. | |
Export CSV | Export the report as a CSV file or a Google Spreadsheet file. | |
Use Sharelinks | Sharelinks are URLs where anyone can download a CSV file that contains the Actuals Report data without accessing the Airbridge dashboard. The data shared through the Sharelink is the data that is accessible with the app role of the Airbridge user who created the Sharelink. |
Following Meta's privacy policy, Meta Ads campaign data is masked in Airbridge until you accept Meta's Advanced Mobile Measurement (AMM) Terms, provided that both of the following conditions are met for the set date range:
The sum of impressions and engaged views from Meta Ads campaigns is less than 1,000
The Meta Ads campaign data is imported to Airbridge through channel integration and cost integration
The masked data will be displayed as follows instead:
Display | Description |
|---|---|
Privacy Block | All data is masked; only "Privacy Block" will be displayed |
+α, ±α | Data is partially masked |
Note
To gain full visibility of your Meta ads campaign data in Airbridge reports, you need to accept Meta’s Advanced Mobile Measurement (AMM) Terms. Otherwise, Meta ads campaign data remains masked in Airbridge. For more information about Meta's AMM terms, refer to this article.
If Meta Ads data is still not visible after agreeing to the terms, you may try changing your report settings as follows:
Change or extend the date range. Only data from periods after consent is provided in raw data.
Change or remove some of the GroupBys and filters.
Sub-rows are not available when granularity is set to Minutely and Hourly. Change the granularity to other options, such as Daily, Weekly, or Monthly.
The table below outlines the features and limitations of the Retention Report.
Supported features and limitations |
Description |
|---|---|
No. of configurable Return Events | 4 |
No. of GroupBys that can be configured | 6 |
Self-serve Metrics, Calculated Metrics, Custom GroupBys | Not supported |
Timezone | Follows the configured Airbridge App timezone |
Data visualized in | Tables |
Data refresh cycle | 1 hour |
Aggregated data | App event data |
Custom events | Supported |
Maximum no. of rows in the Airbridge dashboard | 10,000 rows |
Maximum no. of rows in the CSV file | 10,000 rows |
Data available of | Past 5 years (2023-02-01 and onwards) |
Maximum date range configurable for a single report view | 31 Days |
Was this helpful?