- Marketers Guide
- Reporting
- Retention Analysis
Predictive Lifetime
The predictive lifetime calculation feature provides the estimated number of days a user is likely to return to your service. The predictive lifetime can be used to calculate the predictive lifetime value (pLTV), which can offer valuable insight for effective campaign planning.
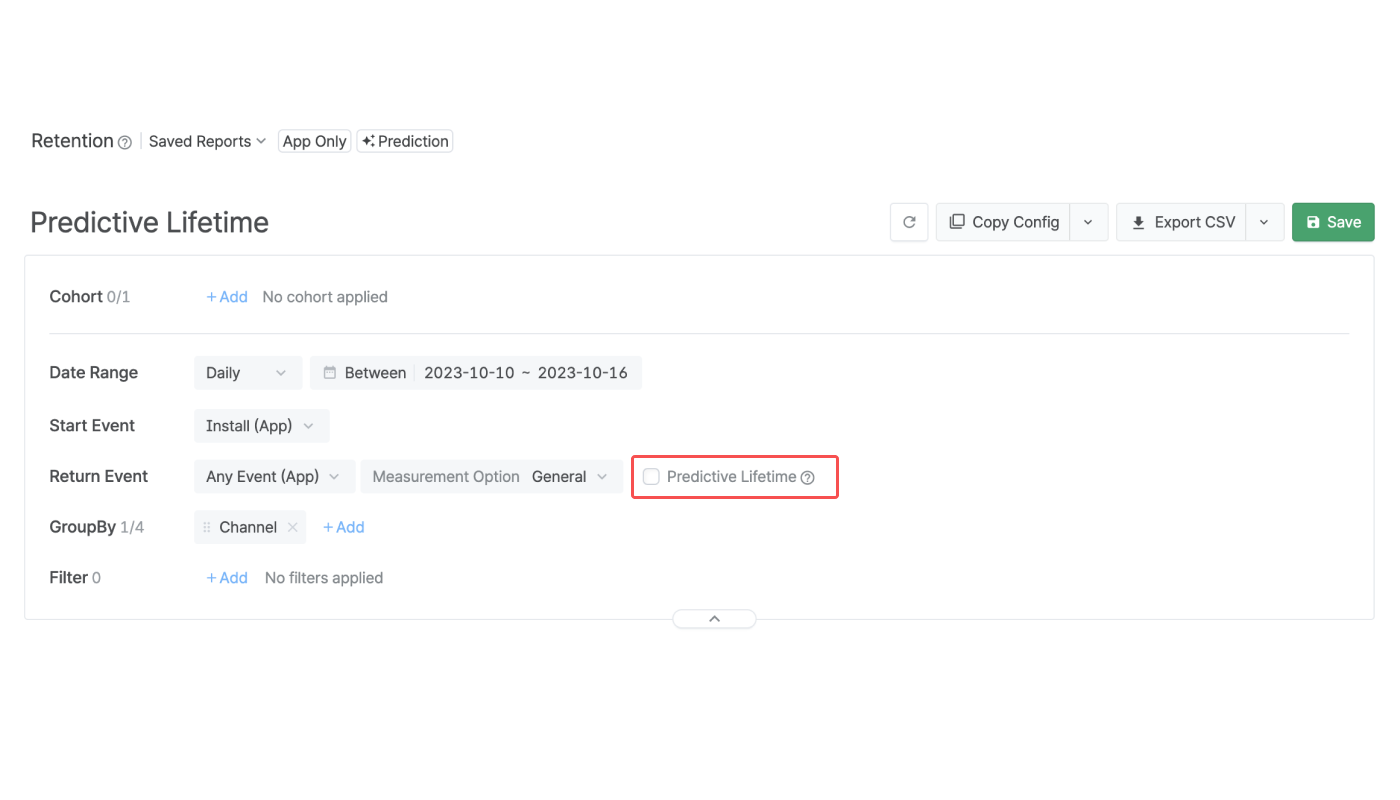
In the Retention Report, check the [Predictive Lifetime] checkbox and set the calculation period to enable the predictive lifetime calculation.
The predictive lifetime in the Retention Report shows the estimated number of days on average the users in a cohort are expected to return to your service. For example, if the predictive lifetime of a cohort is 10 days, it means that the users in the cohort are likely to return to your service for 10 days on average during the set calculation period.
The predicted lifetime is calculated based on Airbridge data, estimating the probability of a user returning to the service. Following Airbridge's machine learning methodology, only past data that meets validity criteria is used for training. Based on the training results, the system estimates how likely users are to revisit the service within the prediction period set in the report.
The following requirements MUST be met to enable the predictive lifetime feature.
The calculation period must be set.
The date range granularity must be set to “Daily.”
The start date of the date range must be set at least 3 days prior to today.
The number of users in a cohort must be at least 30.
For a more accurate calculation, it is recommended to set the start date of the date range at least 13 days prior to today.
When the number of users of a cohort falls short, “Insufficient User Count” will show instead of the predictive lifetime.

When checking the [Predictive Lifetime] checkbox, you can set the calculation period by entering a value between 1 and 1,000.
For example, when you enter 30, the calculation period is set to Day 30, and the predictive lifetime will show the number of days the cohort is likely to return to your service calculated from Day 0 to Day 30.
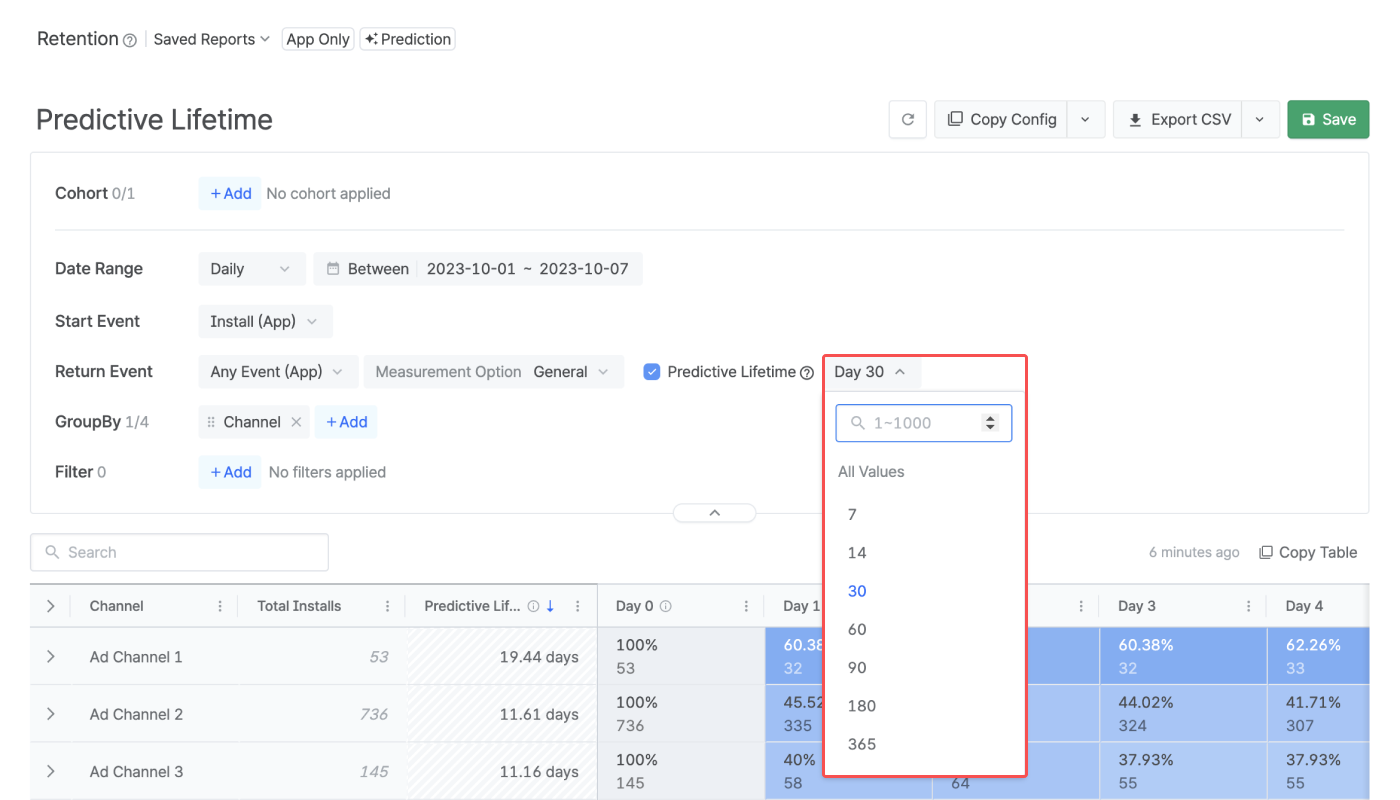
The predictive lifetime column shows the calculated predictive lifetime of each cohort. GroupBys can be added to get a more granular view of the predictive lifetime.
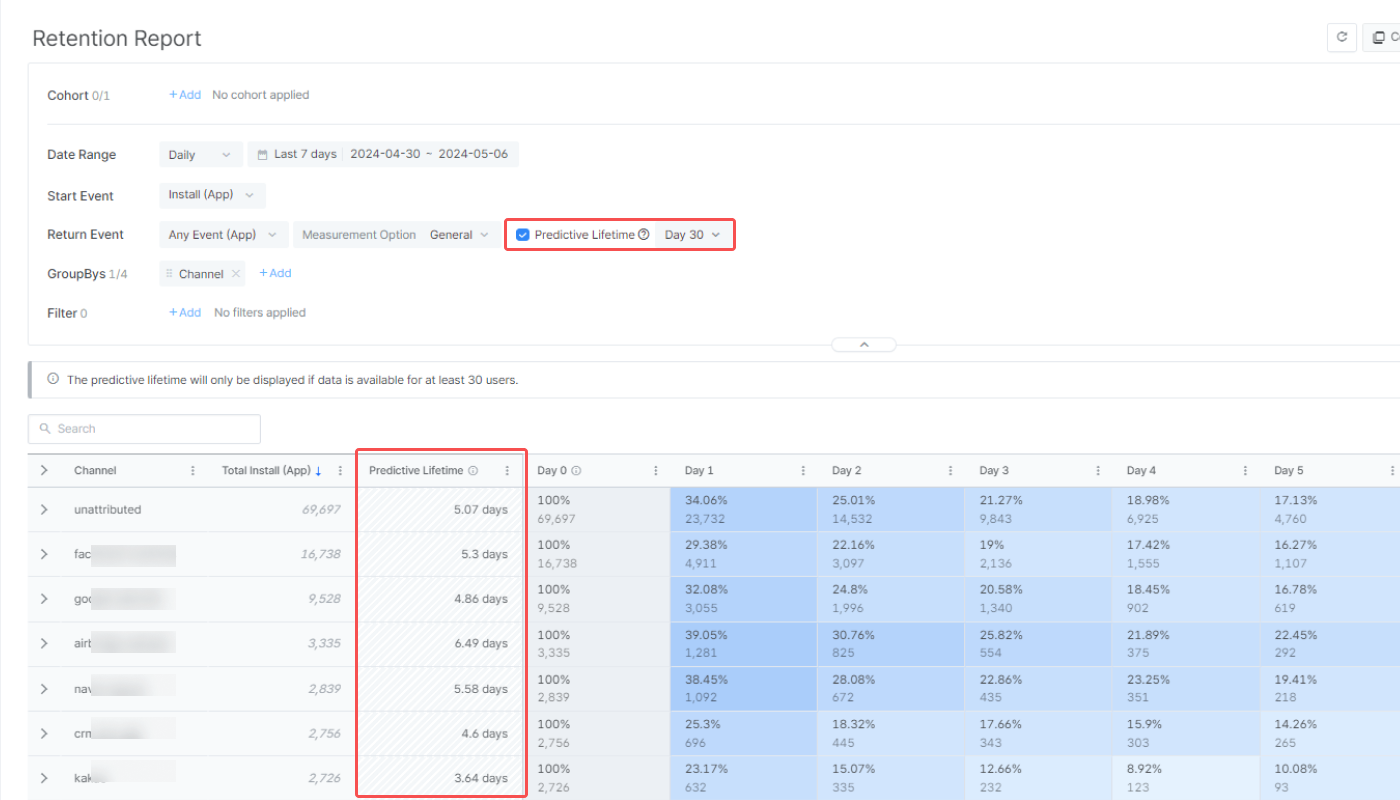
Refer to the following example case.
1. Check the [Predictive Lifetime] checkbox and set the calculation period.
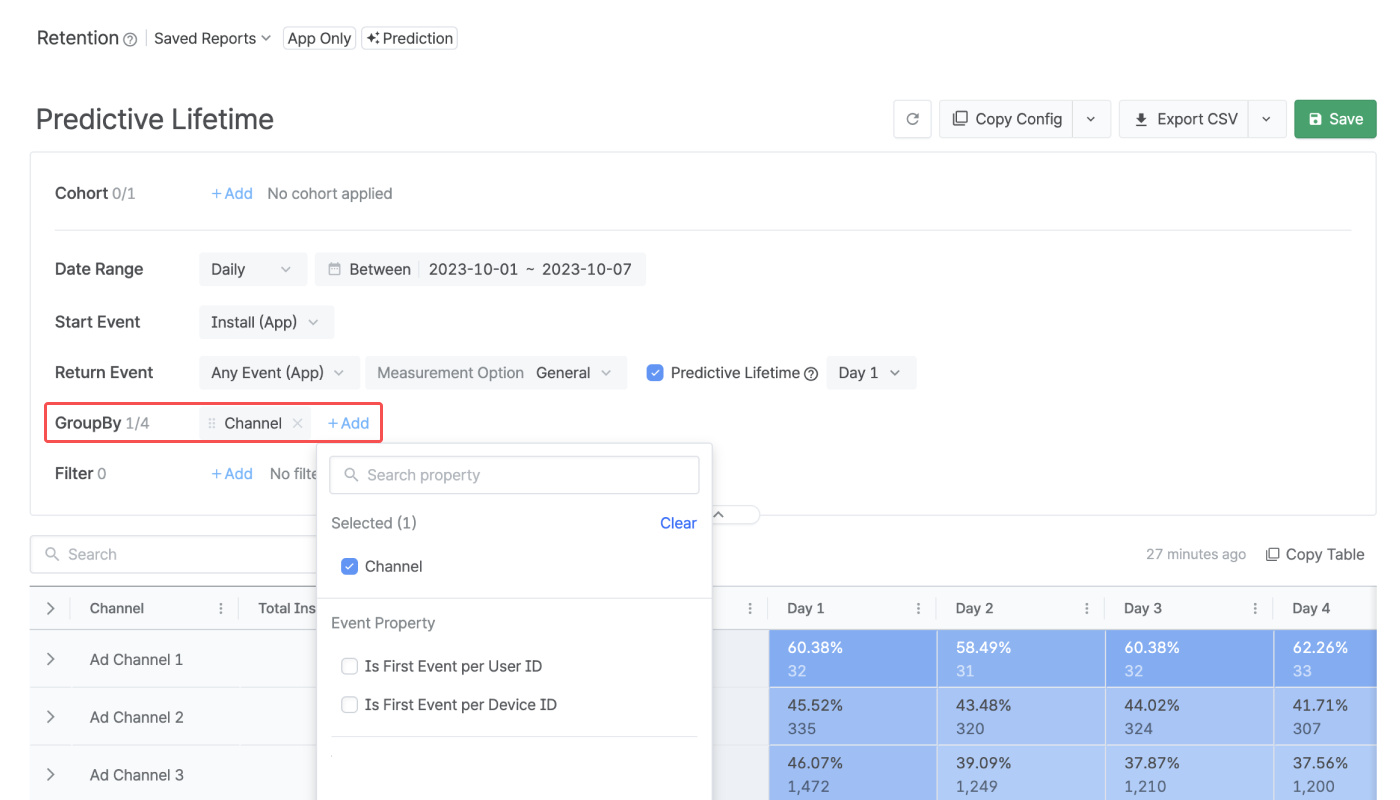
2. Set the start event to Install (App) and add Channel as GroupBy.
3. The predictive lifetime of the users whose installs are attributed to ad channel X can be seen in the predictive lifetime column.
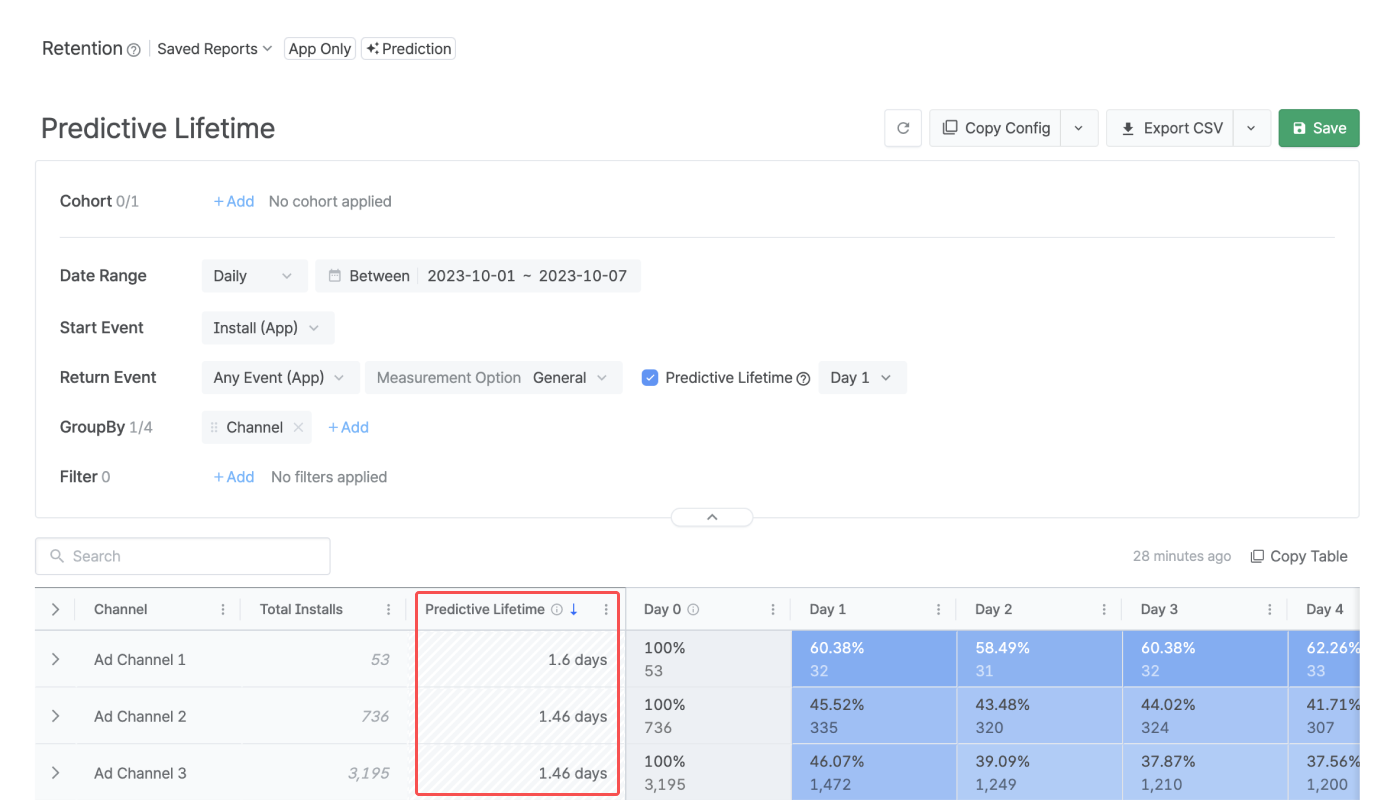
With the predictive lifetime in the Retention Report, the pLTV can be calculated using the following formula.
pLTV = Predictive Lifetime * Average Revenue Per Daily Active User (ARPDAU)
If ARPDAU is not available, the ARPU divided by the number of days can be used instead. The ARPU metric is available in the Revenue Report in Airbridge.
The calculation period must be set.
The date range granularity must be set to “Daily.”
The start date of the date range must be set at least 3 days prior to today.
The number of users in a cohort must be at least 30.
For a more accurate calculation, it is recommended to set the start date of the date range at least 13 days prior to today.
When the number of users of a cohort falls short, “Insufficient User Count” will show instead of the predictive lifetime.

Following Meta's privacy policy, Meta Ads campaign data is masked in Airbridge until you accept Meta's Advanced Mobile Measurement (AMM) Terms, provided that both of the following conditions are met for the set date range:
The sum of impressions and engaged views from Meta Ads campaigns is less than 1,000
The Meta Ads campaign data is imported to Airbridge through channel integration and cost integration
The masked data will be displayed as follows instead:
Display | Description |
|---|---|
Privacy Block | All data is masked; only "Privacy Block" will be displayed |
+α, ±α | Data is partially masked |
Note
To gain full visibility of your Meta ads campaign data in Airbridge reports, you need to accept Meta’s Advanced Mobile Measurement (AMM) Terms. Otherwise, Meta ads campaign data remains masked in Airbridge. For more information about Meta's AMM terms, refer to this article.
If Meta Ads data is still not visible after agreeing to the terms, you may try changing your report settings as follows:
Change or extend the date range. Only data from periods after consent is provided in raw data.
Change or remove some of the GroupBys and filters.
Was this helpful?