
Creating a Retention Report
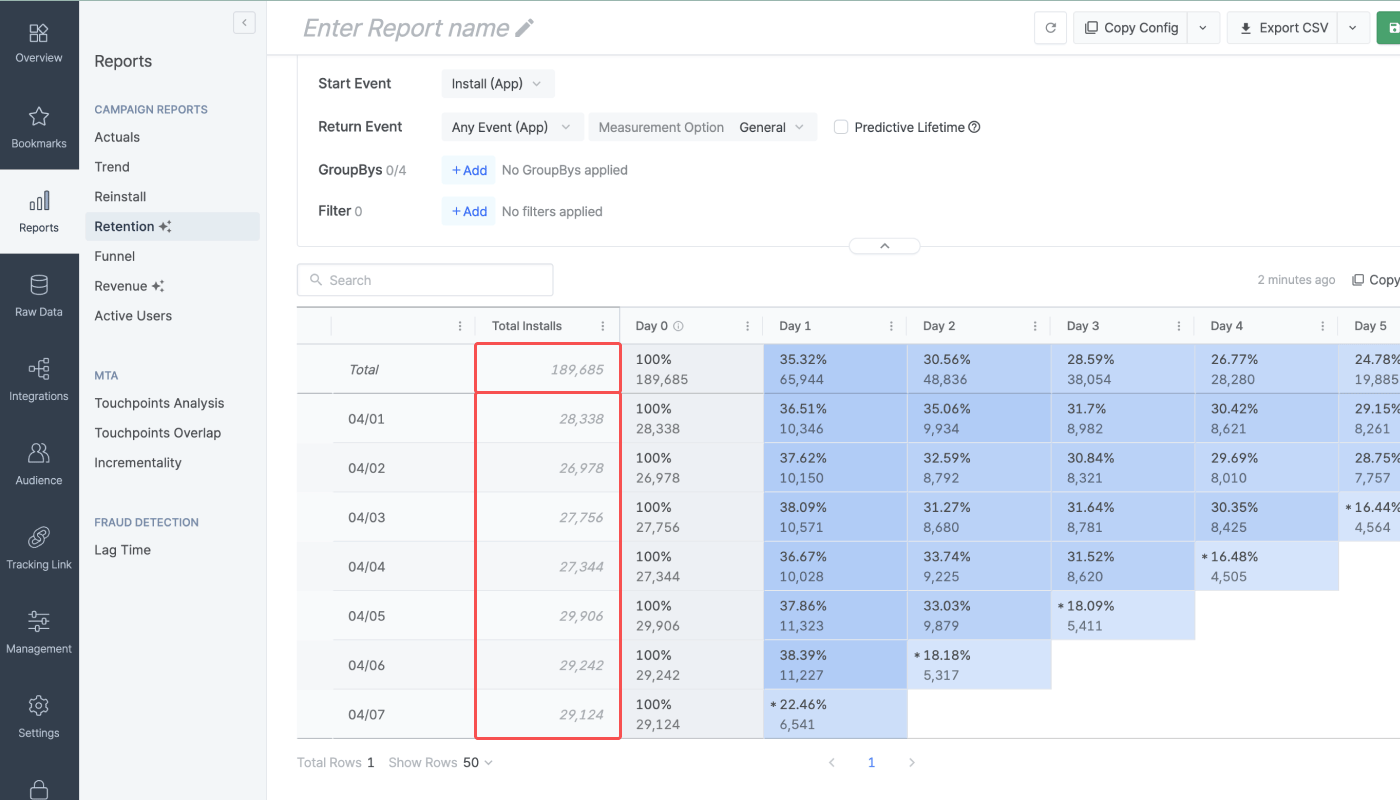
Why is there a discrepancy between the Retention Report and the Actuals Report for the Installs (App) data?
Why is there a discrepancy between the Retention Report and the Actuals Report for the Installs (App) data?
Why is the retention rate in Day 0 displayed as 100%?
Why is the retention rate in Day 0 displayed as 100%?
- User A: Install (App), Subscribe (App)
- User B: Deeplink Open (App), Subscribe (App)
- User C: Add To Cart (App), Install (App)
- User D: Add To Cart (App), Deeplink Open (App)
- Granularity and Date Range: Daily, From 2024-04-01 to 2024-04-05
- Start Event: Install (App), Deeplink Open (App)
- Return Event: Install (App), Deeplink Open (App), Sign-up (App), Order Complete (App)
The number of retained users in the sub-rows don’t add up to the total number displayed in the top row. Why is there a discrepancy?
The number of retained users in the sub-rows don’t add up to the total number displayed in the top row. Why is there a discrepancy?
- Installed the app after clicking a Channel Z’s video ad and deleted the app on 2024-01-01.
- Installed the app again after clicking a Channel Z’s banner ad on 2024-01-02.
- Total number of retained users in the top row for Channel Z (From 2024-01-01 to 2024-01-02): 1
- Number of retained users in the sub-row (2024-01-01) for Channel Z: 1
- Number of retained users in the sub-row (2024-01-02) for Channel Z: 1
How is the Return Event aggregated?
How is the Return Event aggregated?
Is the number of retained users calculated by 24-hour window or by calendar dates?
Is the number of retained users calculated by 24-hour window or by calendar dates?
- Installed the app at 8:00 PM on 2024-01-01
- Opened the app at 10:00 PM on 2024-01-01
- Opened the app at 8:00 AM on 2024-01-02
- Start Event: Installs (App)
- Return Event: Opens (App)
- The number of retained users in Day 0 (2024-01-01): 1
- The number of retained users in Day 1 (2024-01-01): 1
When saving the Retention Report, will be the report settings saved as configured?
When saving the Retention Report, will be the report settings saved as configured?
The number of ranges displayed in the Retention Report are less than the selected range option. Why is it so?
The number of ranges displayed in the Retention Report are less than the selected range option. Why is it so?
- Date Range: January 1, 2024 - January 3, 2024
- Granularity: Daily
- Day N option for Return Events: Max Day 30
Some data points are missing in the sub-rows. Why is it so?
Some data points are missing in the sub-rows. Why is it so?
- Date Range: January 1, 2024 - January 3, 2024
- Cycle: Daily
- Day N option for Return Events: Maximum Day 30
Predictive Lifetime
I can’t view the predictive lifetime in the Retention Report.
I can’t view the predictive lifetime in the Retention Report.
- The granularity must be set to Daily. The start date of the the date range must be set to at least 3 days earlier than today.
- The number of users of a cohort must be at least 30. When the number of users of a cohort falls short, “Insufficient User Count” will show instead of the predictive lifetime.
How can I view the predictive LTV in the Airbridge dashboard?
How can I view the predictive LTV in the Airbridge dashboard?