Airbridge Plans, Plan Limit, and Payment
At Airbridge, you can select a plan for your organization and determine the pricing unit, bucket, volume, and data points through consultation with sales.
Airbridge offers the Growth Plan and DeepLink Plan.
The Growth Plan is the all-inclusive plan ideal for organizations that run multiple campaigns and need accurate attribution and ad performance tracking. Growth Plan users can collect data through tracking links and integrations with ad channels and third parties, visualize ad performance data in various Airbridge reports, export raw data, and configure attribution rules.
The DeepLink Plan is the essential plan ideal for organizations that need deep linking for frictionless user journeys. DeepLink Plan users can create tracking links with deep linking capabilities, customize tracking links for consistent branding, and view the tracking link results in real-time reports.
Below is a quick comparison table between the Growth Plan and the DeepLink Plan.
Feature | Growth Plan | DeepLink Plan |
|---|---|---|
Tracking link generation and management | O | O |
Attribution | O | X |
Reporting | All types of Airbridge reports are available | Only the Actuals Report and Trend Report are available |
Raw data export | O | X |
Ad channel integration | O | X |
Audience management | O | X |
The plan limit is the contracted Airbridge usage limit. The Airbridge usage is calculated across all apps registered within Airbridge. The plan limit is determined by the pricing bucket, pricing unit, usage limit, and data points consulted with sales. Check the details below for the Growth Plan and DeepLink Plan.
Growth Plan | DeepLink Plan | |
|---|---|---|
Pricing Bucket | 1 month or 1 year | 1 month |
Pricing Unit | MAU (App) or Attributed Install | MAU |
Usage Limit | To be negotiated with sales | To be negotiated with sales |
Data Point | To be negotiated with sales | N/A |
Plan Limit | Usage limit and data point limit | Usage limit only |
For sample use cases, refer to this section of this article.
The pricing bucket is the time unit used to measure the Airbridge usage within the contract period. It can be either a month or a year. For example, you can agree on a 1-year contract period while setting the pricing bucket to 1 month.
Airbridge offers the Monthly Active User (MAU) and the Attributed Install as pricing units. Read on to learn how they are used to measure your Airbridge usage.
When selecting MAU as the pricing unit, the number of unique users who have engaged with your app or apps more than once during each calendar month (UTC) is used to measure your Airbridge usage. Users who uninstall the app without any engagement are not counted.
The unique user is determined by the Airbridge Device ID.
The MAU is aggregated as follows:
Aggregation period: From the first day to the last day of each month (UTC)
Aggregated data: The total number of unique users who launched the app
When selecting Attributed Install as the pricing unit, the number of app installs attributed to an ad channel or confirmed by SKAN during each calendar month (UTC) is used to measure your Airbridge usage. The specific aggregation method varies depending on the SKAN version and settings used.
When using the Attribution Overlap for SKAN 4.0, the Attributed Installs are aggregated as follows:
Aggregated data: Attributed Install (App) + SKAN Dedup Install (App)
Let's say your report shows the following.
Attributed Install (App) | SKAN Dedup Install (App) | |
|---|---|---|
Ad Channel X | 700 | 100 |
Ad Channel Y | 200 | 0 |
In this case, for Ad Channel X, the Attributed Install (App) measured by Airbridge is 700. The SKAN Dedup Install (App), which is the Attributed Installs measured by SKAN only after excluding the duplicate installs (measured by Airbridge using IDFA), is 100. Therefore, the Attributed Installs used for measuring Airbridge usage regarding Ad Channel X is 800 (700+100).
For Ad Channel Y, the Attributed Install (App) measured by Airbridge is 200. The SKAN Dedup Install (App), which is the Attributed Installs measured by SKAN only after excluding the duplicate installs (measured by Airbridge using IDFA), is 0. Therefore, the Attributed Installs used for measuring Airbridge usage regarding Ad Channel Y is 200 (200+0).
As a result, the Attributed Installs used for measuring Airbridge usage for all ad channels is 1,000 (800+200).
If you are NOT using the "Attribution Overlap" feature in Airbridge for SKAN 4.0 or if you are using Airbridge for SKAN 3.0, the number of Attributed Installs is aggregated as follows:
Aggregated data: The larger value between Attributed Installs (App) and SKAN Installs (App) is determined for each ad channel, and the larger values of each channel are summed.
Let's say your report shows the following.
Attributed Install (App) | SKAN Install (App) | |
|---|---|---|
Ad Channel X | 200 | 15 |
Ad Channel Y | 110 | 300 |
By using the larger values for the Airbridge usage calculation, the Attributed Installs are 500 (200 + 300).
Data points are used to determine the maximum number of app events that can be collected within the contract period. When 1 app event is collected, 1 data point is consumed. The total number of data points is the maximum number of events that Airbridge can collect across all apps within your organization. It is calculated by multiplying the contracted data points per pricing unit by the contracted usage limit.
Airbridge offers 100, 200, 300, 400, 500, or 600 data points per Monthly Active User. The total number of data points within the contract period is calculated as follows.
Data points = (Contracted data points per Monthly Active User) * (Contracted usage limit)
Airbridge offers 1,000, 2,000, 3,000, or 4,000 data points per Attributed Install. The total number of data points within the contract period is calculated as follows.
Data points = (Contracted data points per Attributed Install) * (Contracted usage limit)
Below are sample cases to help you understand how Airbridge usage and total data points are calculated.
Let’s say your organization's plan details are as follows.
Product Plan: Growth Plan
Contract Period: Jan 01, 2025 to Dec 31, 2026
Pricing Bucket: 1 year
Pricing Unit: Attributed Install
Usage Limit: 1M/year
Data points per usage unit: 100 per Attributed Install
Number of Apps Added to Airbridge: 2 apps
How the Airbridge usage is measured
The usage is measured by the sum of the Attributed Installs that occur for the 2 apps registered within your organization in Airbridge. The usage limit is 1M Attributed Installs for each period from Jan 1, 2025, to Dec 31, 2025, and from Jan 1, 2026, to Dec 31, 2026.
How total data points are calculated
The data points for each period from Jan 1, 2025, to Dec 31, 2025, and from Jan 1, 2026, to Dec 31, 2026, are calculated as follows.
Data points: 1,000,000 * 100 = 100,000,000
This means that the number of app events collected from the 2 apps cannot exceed 100,000,000 events for each period from Jan 1, 2025, to Dec 31, 2025, and from Jan 1, 2026, to Dec 31, 2026.
Let’s say your organization’s plan details are as follows.
Product Plan: DeepLink Plan
Contract Period: Jan 01, 2025 to Dec 31, 2026
Pricing Bucket: 1 Month
Pricing Unit: MAU
Usage Limit: 5M/month
Number of Apps Registered with Airbridge: 3 apps
How the Airbridge usage is measured
The usage is measured by the sum of the Monthly Active Users (MAUs) that occur for the 3 apps registered within your organization in Airbridge. The usage limit is 5M MAUs for each month.
Note
Only Airbridge users with the Admin or Manager organization role can access the [Plan & Usage] menu.
Your organization’s current Airbridge plan and usage data can be found on the [Organization]>[Plan & Usage] page in the Airbridge dashboard.
On the [Organization]>[Plan & Usage] page in the Airbridge dashboard, you can view the details of the current Airbridge plan in the [Current Plan] tab under the “Plan Details” section.
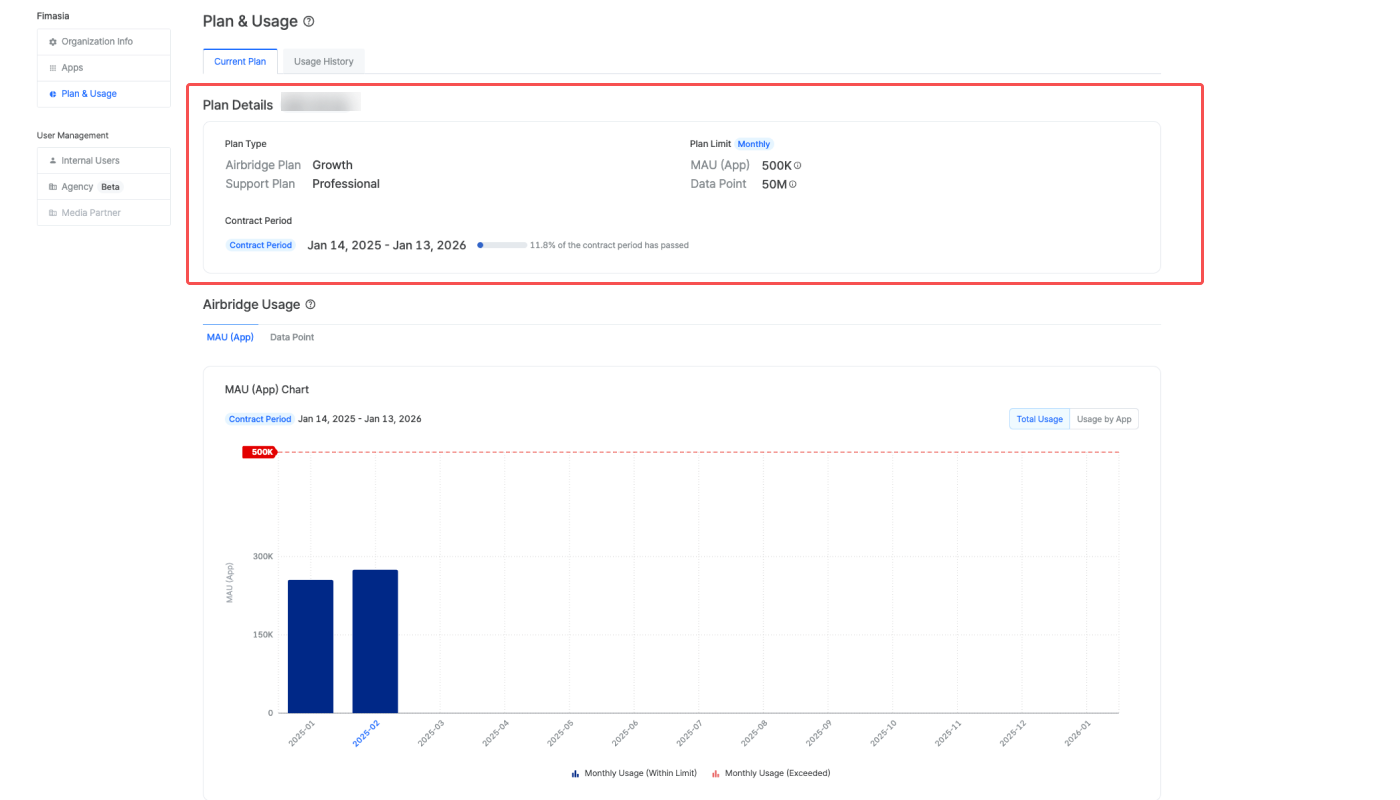
The following information can be found under “Plan Details.”
Item | Description | Example |
|---|---|---|
Contract ID | The contract ID is displayed next to “Plan Details,” as stated in the current Airbridge usage contract. | ABR-000000 |
Airbridge Plan | This is the Airbridge plan the organization is currently using. | Growth Plan or DeepLink Plan |
Support Plan | The contracted pricing unit is used to measure the Airbridge usage. This is the support plan the organization is currently using. | MAU or Attributed Install Standard or Professional |
Pricing Bucket | The time unit used to measure the Airbridge usage is consulted with sales. | Monthly or Annual |
Pricing Unit and Usage Limit | The contracted usage limit per month or year is consulted with sales. | MAU 5M or Attributed Install 10M |
Data Point | The maximum number of app events allowed to be collected is consulted with sales. Data points = (Contracted data points per pricing unit) * (Contracted usage limit) | 10M |
Contract Period | The start and end date of the current contract. | Nov 24, 2024 - Nov 23, 2025 |
Contract Period Progress Bar | The progress bar displays how much of the contract period has passed (%). | 10% of the contract period has passed |
The usage data is visualized in the chart and table below the “Plan Details” section in the [Current Plan] tab on the [Organization]> [Plan & Usage] page in the Airbridge dashboard.
Note
The data in the usage chart and table are not updated in real time. For accurate reporting, the usage data is updated after adjustments that may take up to 8 days. The updated data is applied to the dashboard at 3:00 PM (UTC) daily.
The contracted pricing unit, the MAU or Attributed Install, is used to measure your organization’s Airbridge usage. If your usage is measured using units other than MAU or Attributed Install, contact sales or the Help Center for inquiries about your Airbridge usage.
If your contract includes a data point limit, you will see under "Airbridge Usage" 2 tabs: 1 tab that shows your Airbridge usage based on the pricing unit, and 1 tab that shows your data point usage.
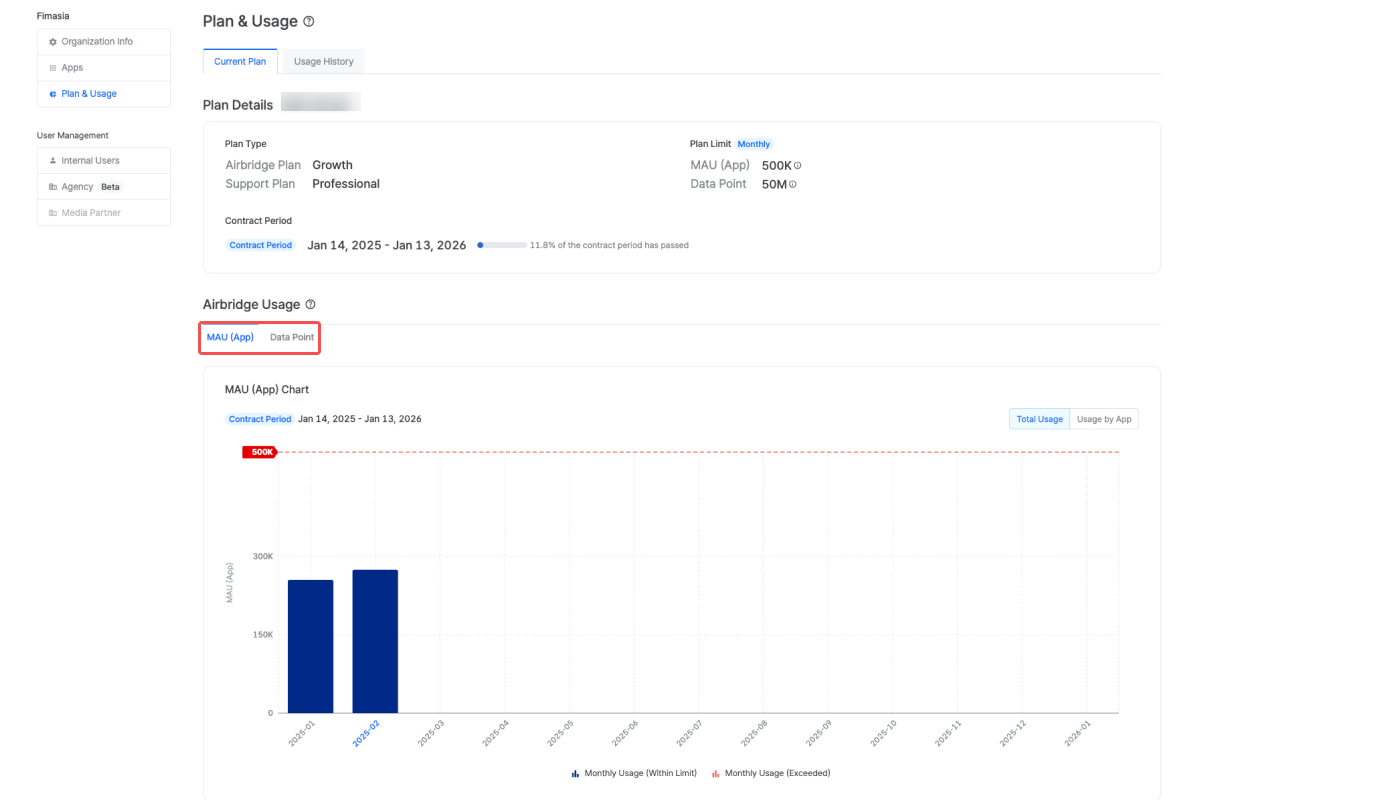
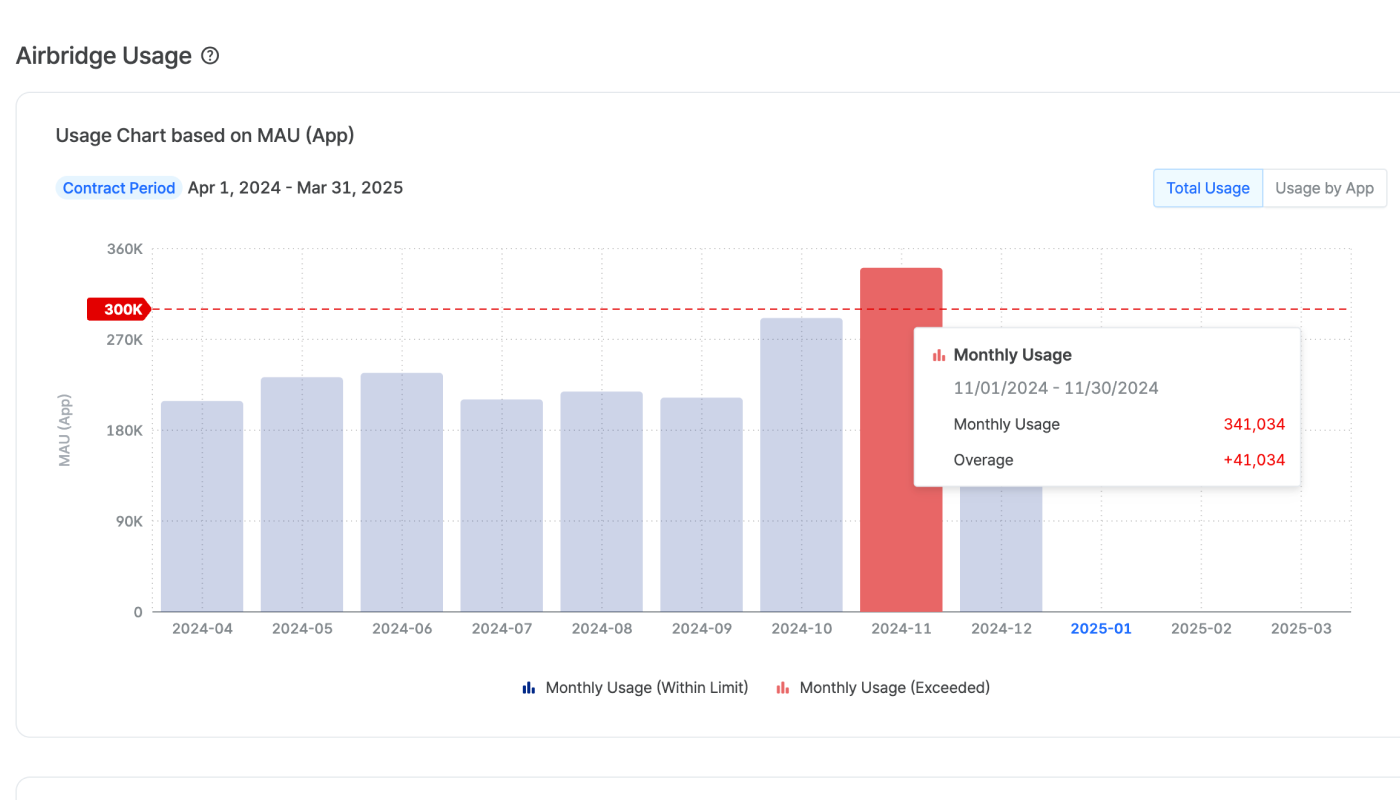
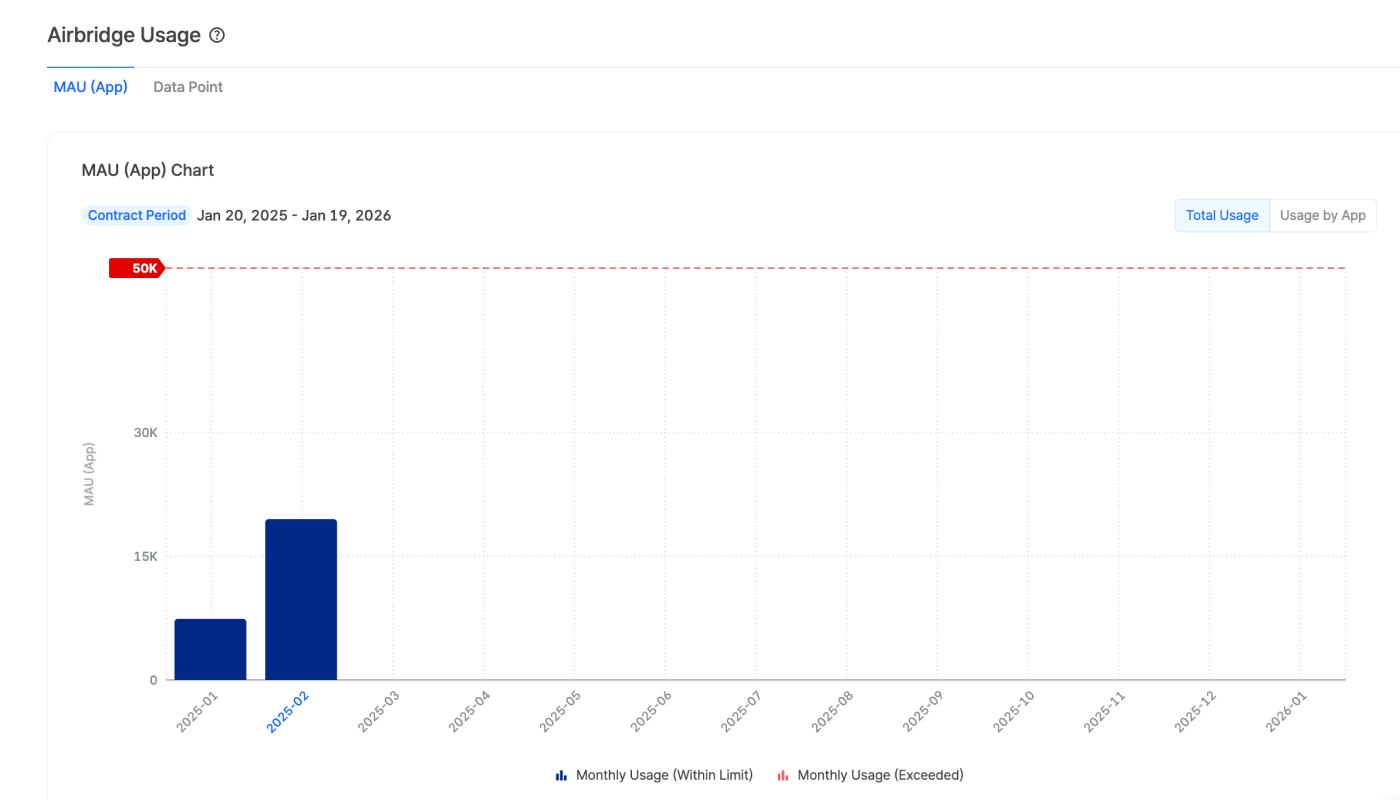
Click Total Usage to view the total Airbridge usage or click Usage by App to view the usage by app registered within your organization in Airbridge.
The monthly usage is displayed in a bar format, with each bar representing the usage for a month. If overages occur in a specific month, the bar will appear in red. Hovering over each bar will show the usage and any overages measured in the contracted pricing unit.
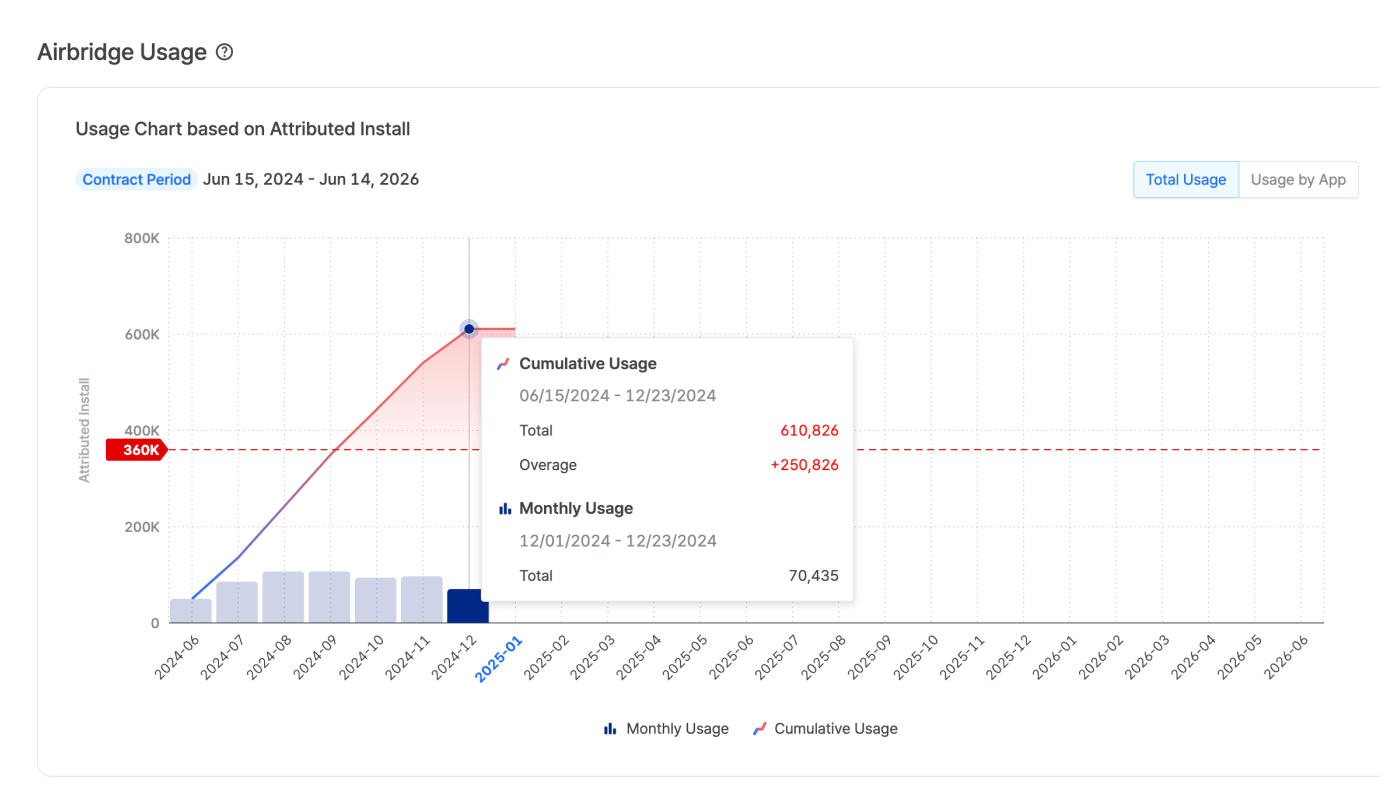
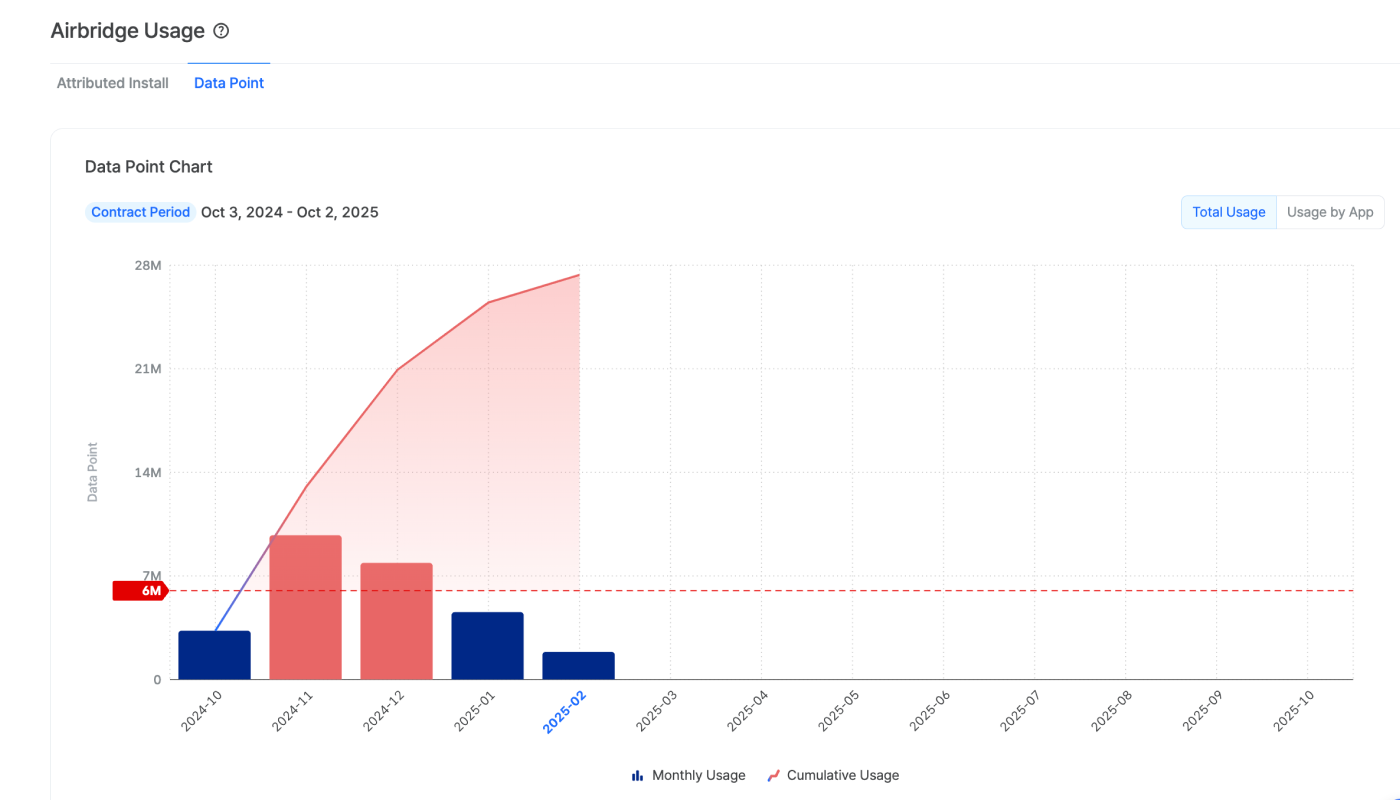
The monthly usage is shown in bars, while the cumulative usage data is represented in a line. If overages occur, the line will appear in red starting from the month the usage limit is surpassed. Hovering over each bar shows the monthly usage, cumulative usage, and overages measured in the contracted pricing unit.
The monthly data point usage is displayed in a bar format, with each bar representing the usage for a month. If overages occur in a specific month, the bar will appear in red. Hovering over each bar shows the usage and any overages measured.
The monthly data point usage is shown in bars, while the cumulative data is represented in a line. If overages occur, the line will appear in red starting from the month the usage limit is surpassed. Hovering over each bar shows the monthly usage, cumulative usage, and overages measured.
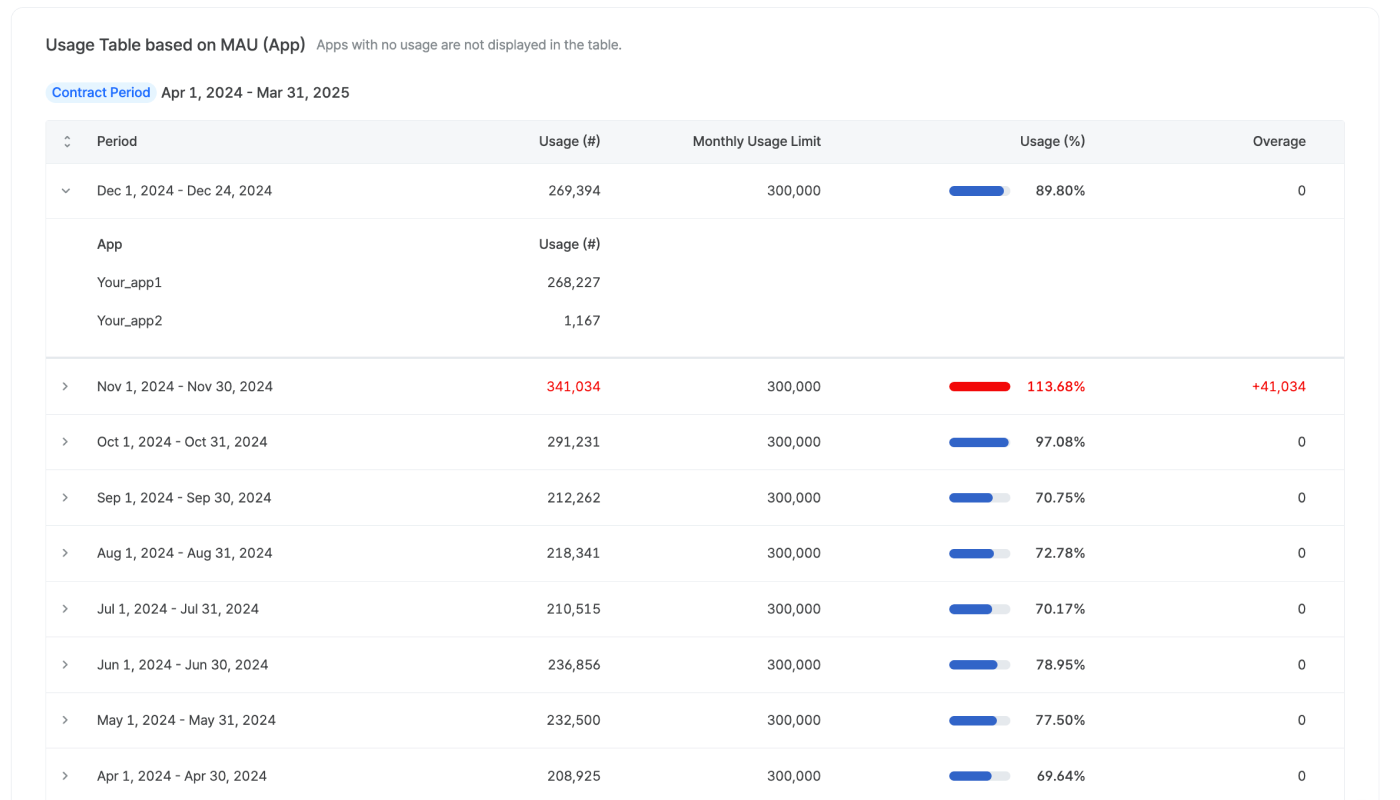
In the usage table, you can find the detailed usage data, including monthly usage, usage limit, and any overages. Clicking on the monthly period will show the monthly usage measured per app added to Airbridge. The overage data will appear in red.
Note
Only contracts that started after February 1, 2023, will be displayed in the [Usage History] tab.
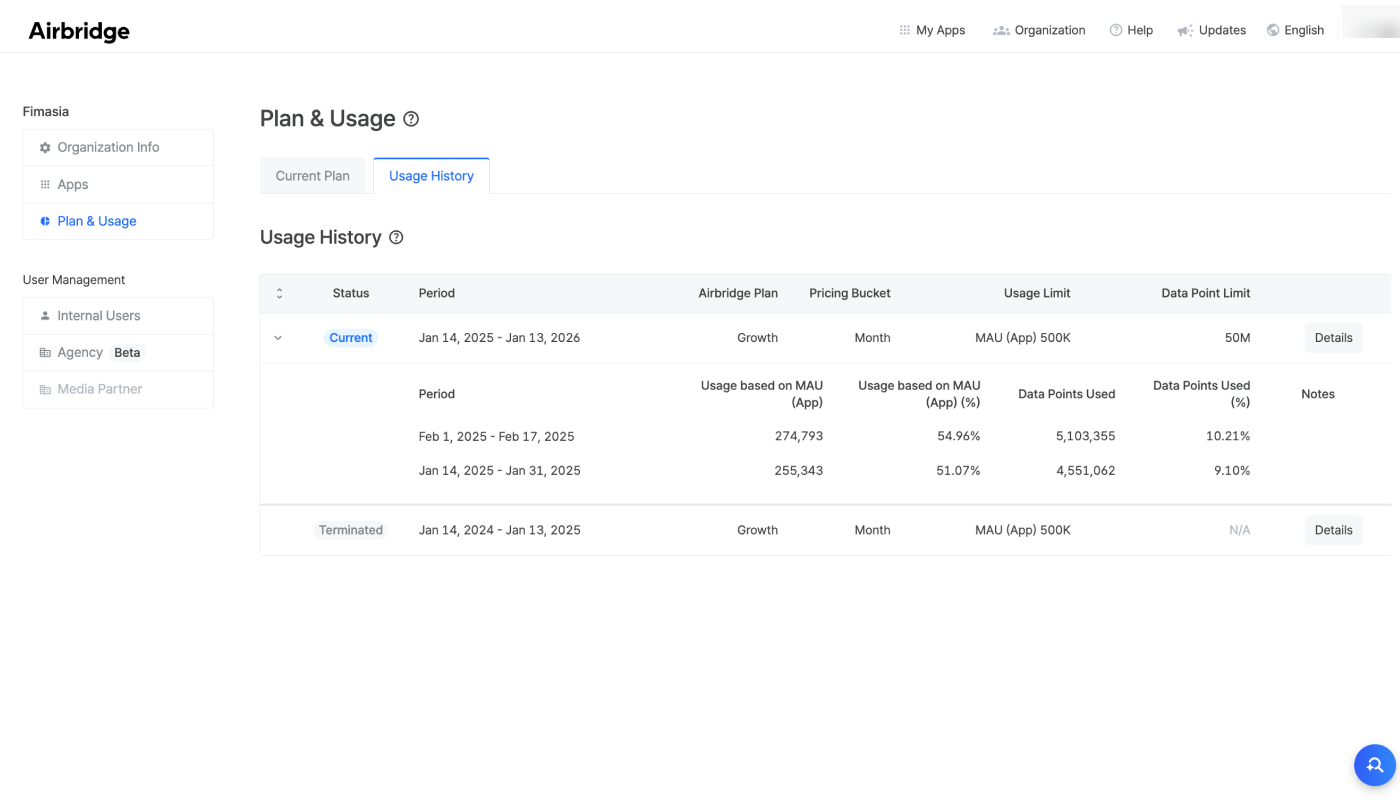
The details of the contracts that started after February 1, 2023, and the usage history can be found in the [Usage History] tab on the [Organization]>[Plan & Usage] page in the Airbridge dashboard.
The contract status is displayed as follows.
Contract Status | Description |
|---|---|
Current | Active contract. |
Upcoming | Contract yet to begin. Will start after the current contract. |
Terminated | Contract past its end date. |
For “Current” and “Terminated” contracts, you can find the usage data measured by the contracted pricing unit when clicking on the contract period. The overages appear in red. For “Upcoming” contracts, you can only find the usage limit information.
Clicking Details of each contract will open a side panel that lists the contract details in full.
For detailed information on pricing, payment dates, and payment methods, contact sales.
Was this helpful?