- Marketers Guide
- Reporting
- More Airbridge Reports
Reinstall Report
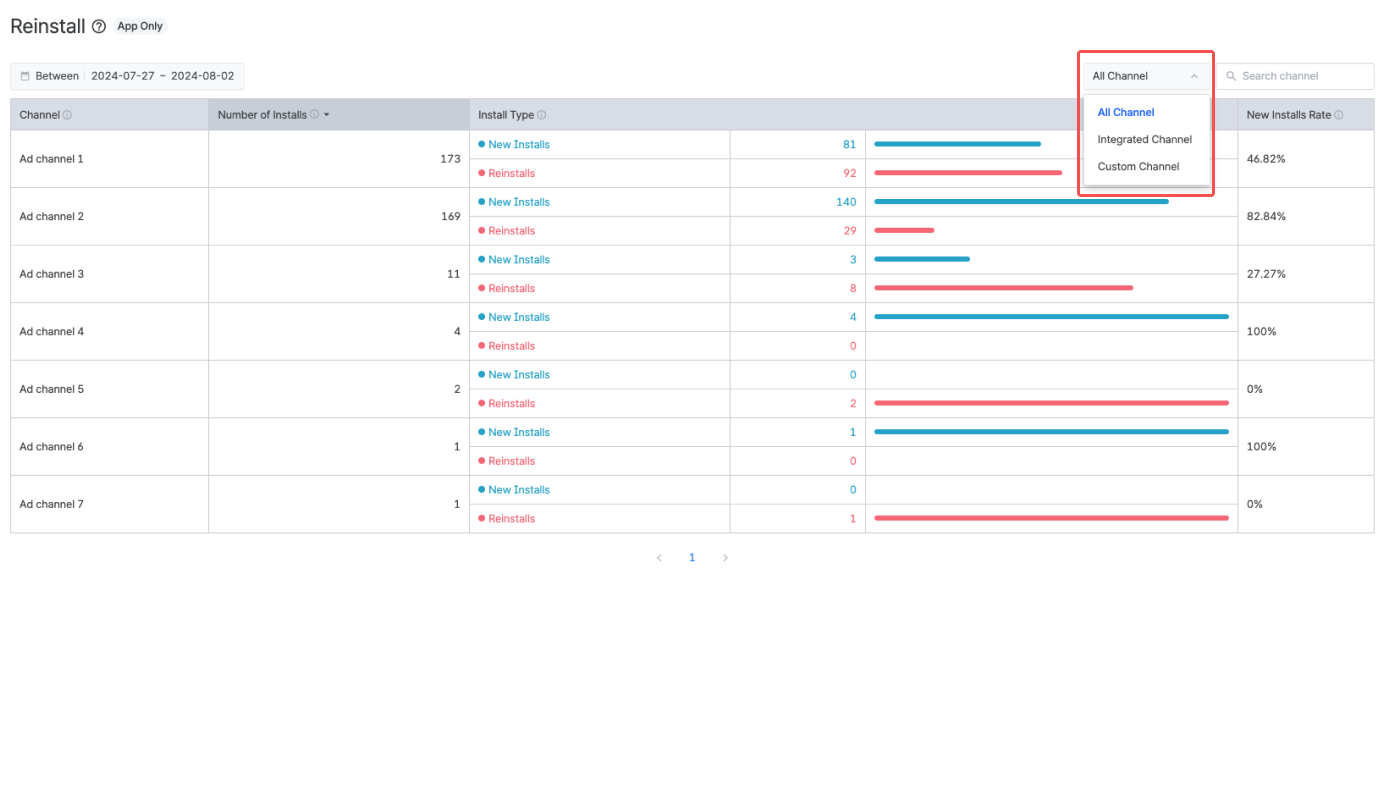
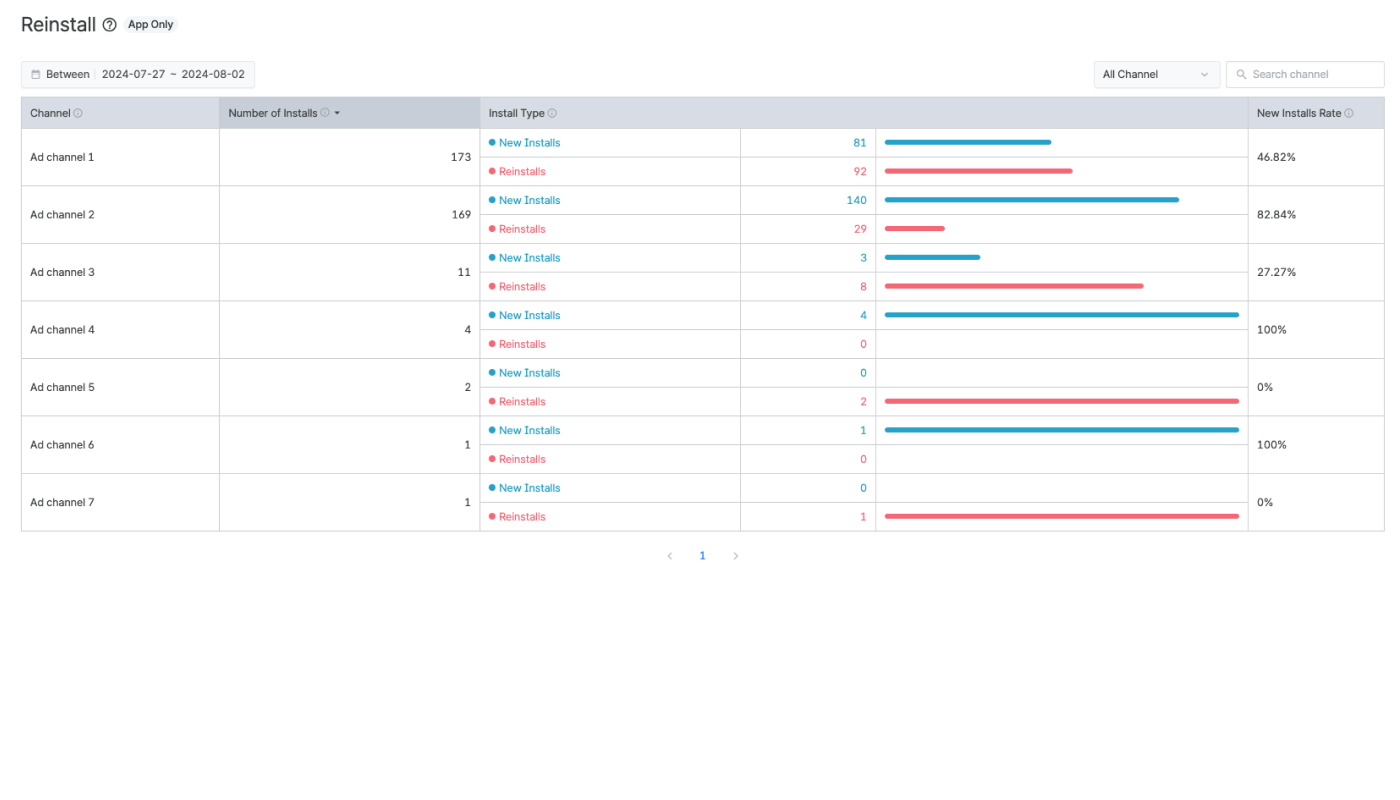
In the Reinstall Report, you can gain insights into the channels that drive the most installs and the ratios of new and reinstall users.
When a user installs an app and installs the app again within a year, that install is categorized as a reinstall.
For example, let's say a user performed the following events.
2020-01-01: First install
From 2020-01-02 to 2021-01-01: No event
2021-01-02: Install
The install performed on 2021-01-02 is categorized as a new install.
Let's say the same user performed the following events.
2021-01-02: Install
2021-03-01: Install
The install performed on 2021-03-01 is categorized as a new reinstall as it was performed within 1 year after the install that was performed on 2021-01-02.
The Reinstall Report shows the number of unique installs that occurred during the set date range as well as the number of users who performed first installs and reinstalls.
The Reinstall Report shows unique installs that occurred during the set date range. Use the calendar filter to configure the date range.
The date range can be set using the following conditions.
Condition | Date Range |
|---|---|
Between | From start date to end date |
Since | From start date to today |
Last | Last n days/weeks/months until yesterday |
When using “Last,” options such as “Include today,” “Include this month,” and “Offset” can be added.
For example, if you select Last 30 days and add Offset + 3 days, the date range will start 33 days before today and end 4 days before today.
You can view the data by channel type.

The available channel types are as follows.
All Channels: Shows data of all integrated channels and custom channels.
Integrated Channel: Shows data of integrated channels.
Custom Channel: Shows data of custom channels.
The Reinstall Report allows you to view results based on the set date range and channel type. The report displays the total number of unique installs, the number of users who performed first installs and re-installs, and the ratio of first installs.

Refer to the table below to learn how to share your report with others.
Feature |
Description |
User Guide |
|---|---|---|
Grant App Access | Invite users to the Airbridge App and assign app roles. The data users can access depends on their app roles. |
The table below outlines the features and limitations of the Reinstall Report.
Supported features and limitations |
Description |
|---|---|
Self-serve Metrics, Calculated Metrics, Custom GroupBys | Not supported |
Timezone | The configured Airbridge App timezone. Configurable per report view. |
Currency | The configured Airbridge App standard currency |
Data visualized in | Tables, charts |
Data refresh cycle | Real-time |
Aggregated data | App event data |
Custom events | Not supported |
Maximum no. of rows in the Airbridge dashboard | 40 rows |
Maximum no. of rows in the CSV file | 40 rows |
Data available of | Past 1 year (From D-365 to D-0) |
Maximum date range configurable for a single report view | 90 days |
Was this helpful?