
Configuring a Report View
Click Configuration to open the side panel. The configuration settings apply only to the table. The chart displays the CTIT by channel and is not affected by the configuration settings.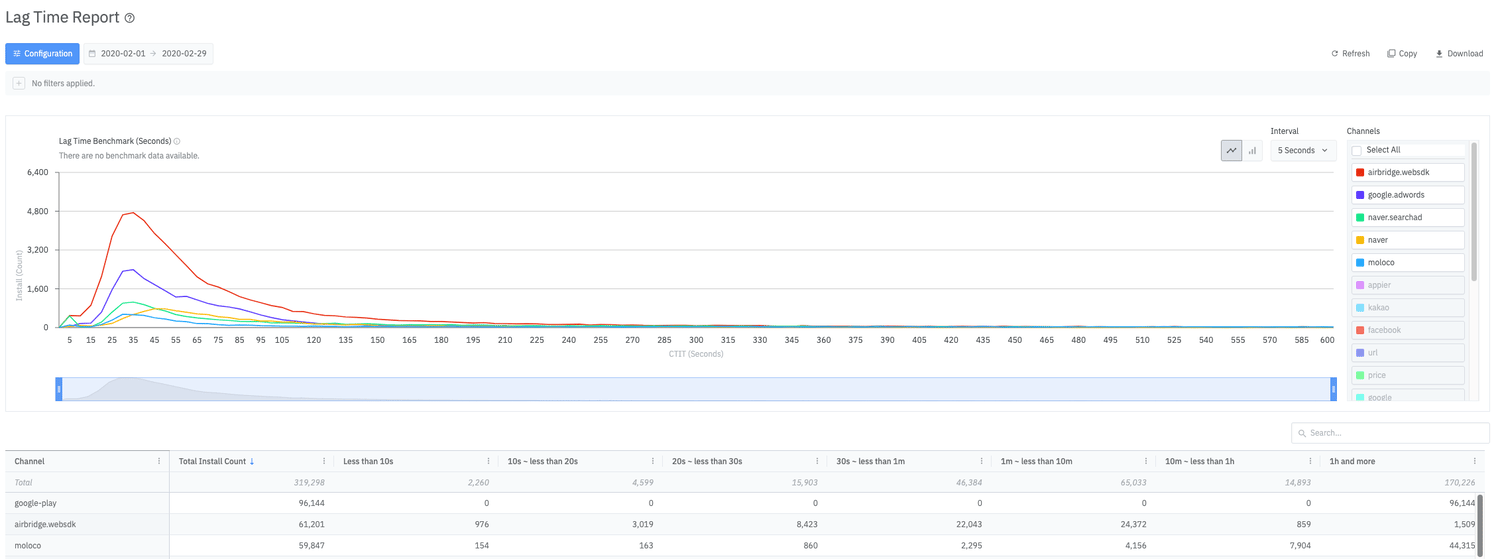
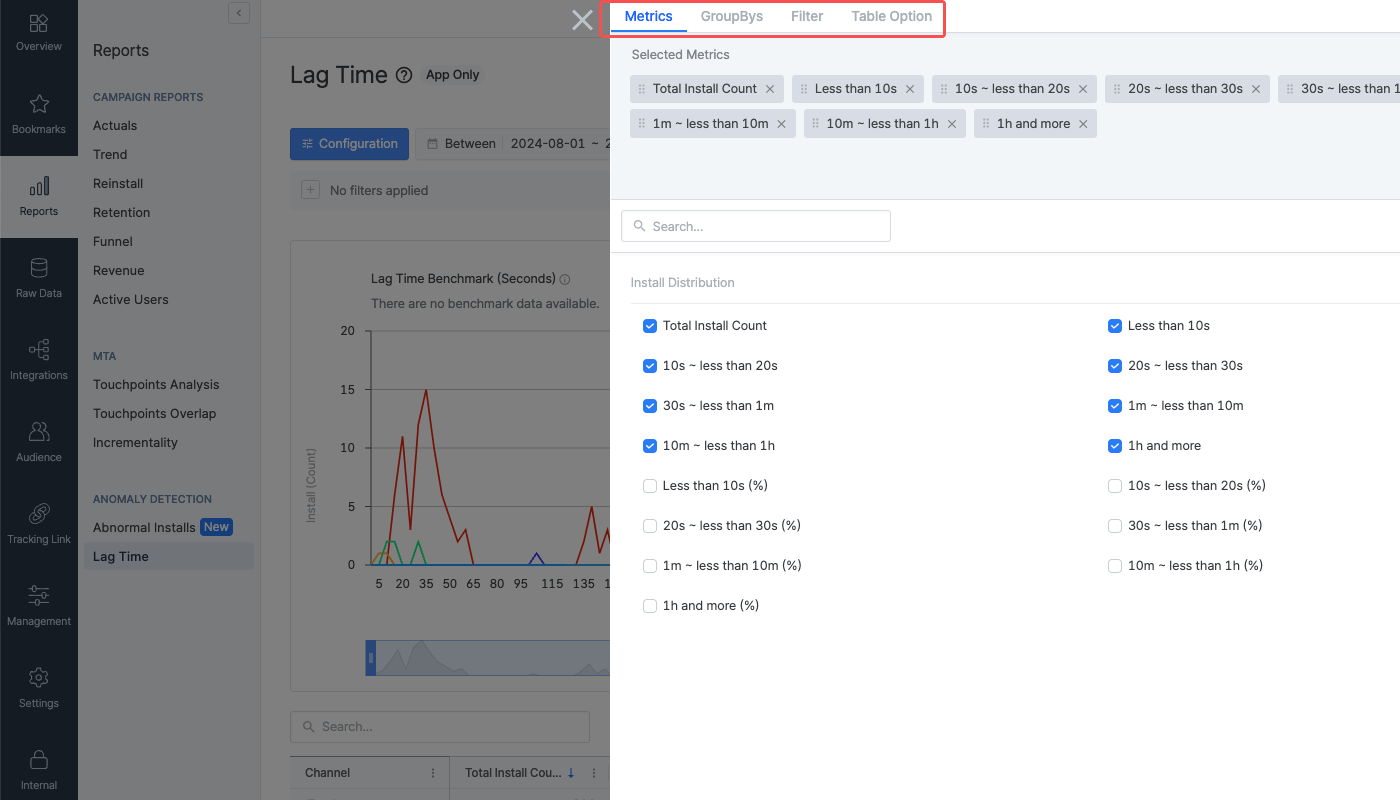
Understanding the Lag Time Report
The Lag Time Report provides data in a chart and a table. The configuration settings apply only to the table.Chart
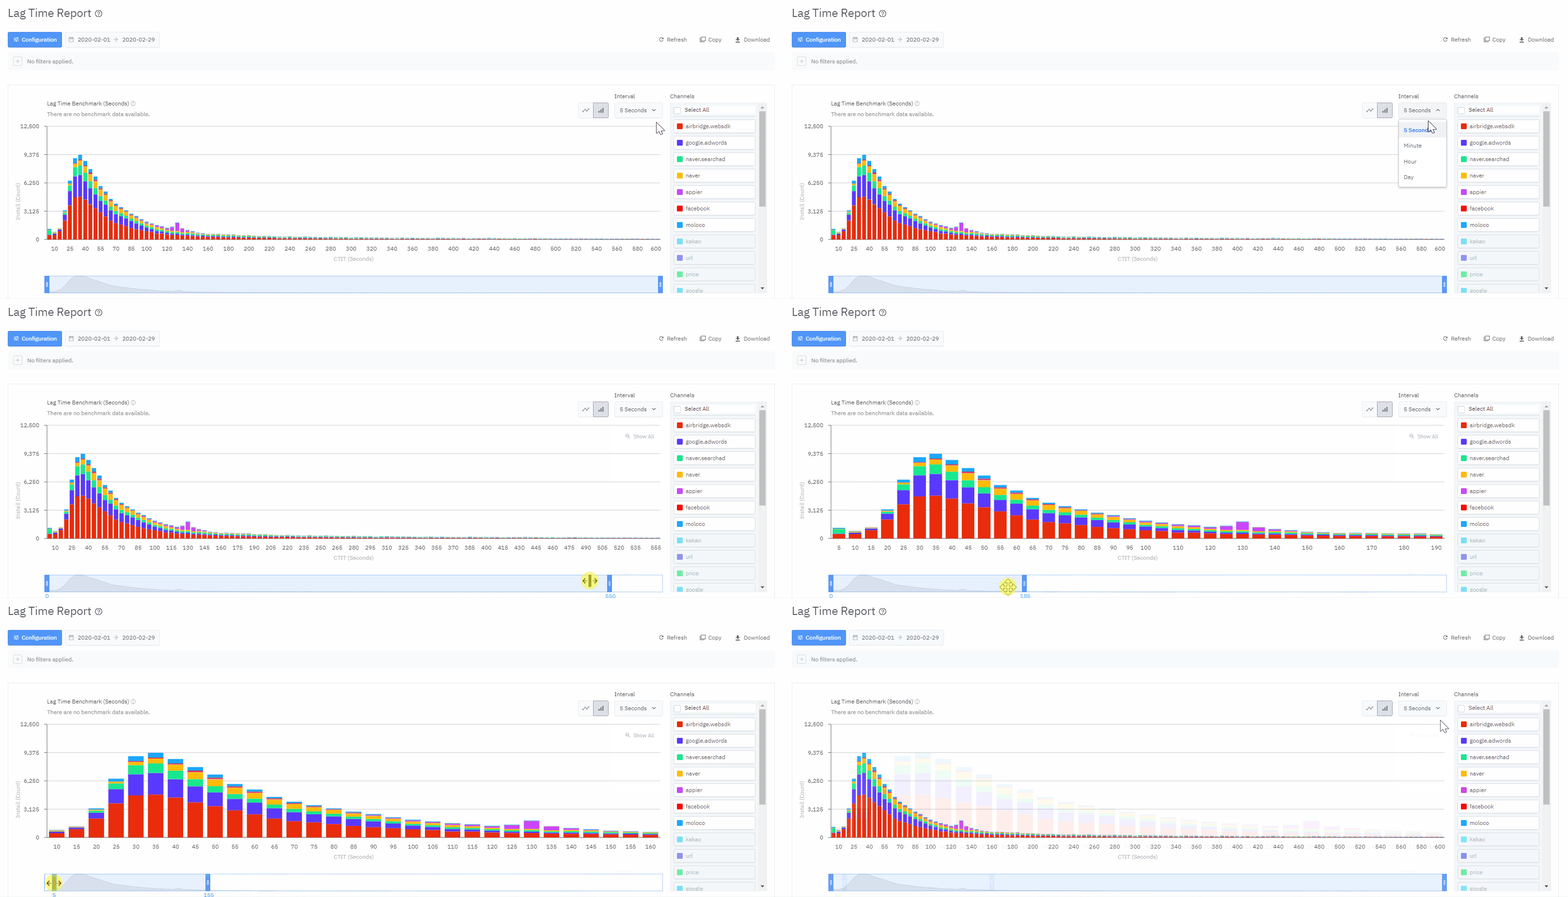
The chart shows the CTIT distribution by channel and is not affected by the configuration settings. Hover over the trend line of a channel to view its install count and percentage of total installs. Click on the items in the legend on the left of the chart to show or hide the trend lines in the chart.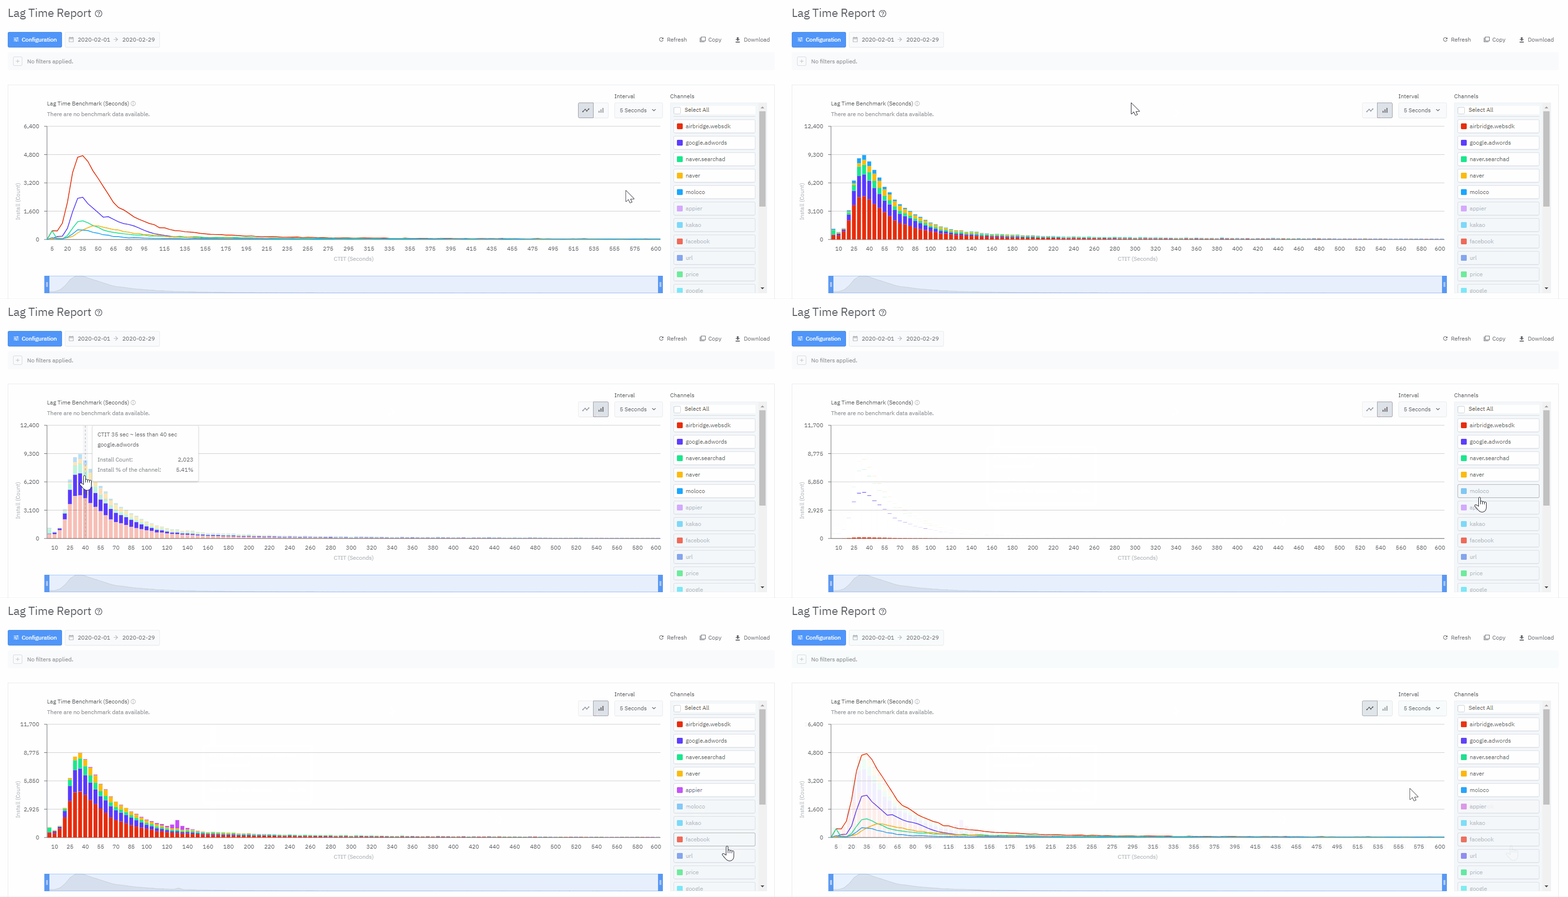
Table
The configured metric, GroupBy, filter settings apply to the table only.Using the Lag Time Benchmark Data
The benchmark CTIT is the time it took for users from clicking the app download button in the Google Play Store to launching the app for the first time. Negative CTIT values that are unknown or negative are excluded from the benchmark CTIT calculation.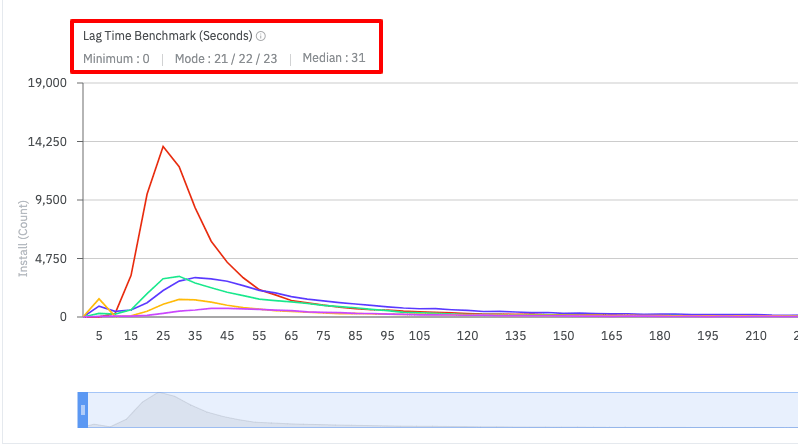
Supported features
Attention
Supported features and limitations of the Lag Time Report
Supported features and limitations of the Lag Time Report
The table below outlines the features and limitations of the Lag Time Report.