FAQ - More Airbridge Reports
The app install counts in the Touchpoints Analysis Report and the Touchpoints Overlap Report may not be displayed the same due to the following reasons.
Timezone difference
Aggregation difference
The reports are based on different time zones.
The timezones for the Touchpoints Analysis Report and the Touchpoints Overlap Report are fixed to KST. The timezone for the Actuals Report, however, is based on the App timezone by default and can be changed to a different timezone by report view.
Therefore, unless the timezone for the Actuals Report is set to KST, the app install count may differ between the Touchpoints Analysis Report or the Touchpoints Overlap Report and the Actuals Report.
When selecting Installs as the analysis target in the Touchpoints Analysis Report and Touchpoints Overlap Report, the Total or Total Conversions shows the number of total installs, which is the first install a unique user has performed during the set date range.
In the Actuals Report, however, when selecting the Installs (App) as a metric, you can view the total number of installs performed during the set date range. Therefore, install count may include multiple installs performed by a single user.
Refer to the example below.
Example
Reports may show a single user's app install count differently. For example, let's say a user performed the following events.
App installed on January 1
App deleted on January 2
App installed on January 3
When the date range is set for January 1 to January 3, the app install count will appear in the respective reports as in the following table.
Touchpoints Analysis Report |
Touchpoints Overlap Report |
Actuals Report |
|---|---|---|
1 | 1 | 2 |
The results provided by the AI Assistant in the Unattributed Conversion Analysis and the Abnormal Installs Report are not fixed for 48 hours. This is because the data used by the AI Assistant is enriched every day at 0:00 AM (UTC). Let's say, for example, you have queried data on May 3, 0:00 AM, the data of May 1, 0:00 AM to May 3, 0:00 AM may not have been fixed and is subject to change.
“More data is required” means that more data is required for the AI Assistant to function.
"No data to show" indicates that although there is sufficient data for the AI Assistant to function, there is no data to display for the query in the report.
Airbridge identifies devices as the same if the following 8 items collected from them match: client IP, device manufacturer, device model, operating system, network carrier, WiFi activation status, timezone, and locale.
The Click-To-Install-Time (CTIT) refers to the duration between when a user interacts with an ad and when they install the app. Airbridge calculates CTIT by determining the time difference between the touchpoint that prompted the install and the app install.
The typical CTIT range is established by assessing all CTIT values of all app install events within the past 30 days based on the set date range in the report. Extremely short or long ones are excluded from the assessment.
The AI Assistant simply reports abnormal installs that fall into the category defined as abnormal to help you make informed decisions about handling abnormal installs in the ad performance measurement process.
For example, Airbridge users may interpret the abnormal installs with no in-app events within 24 hours differently. One may think that the users just didn’t perform any actions on the app within 24 hours, whereas others could see this as the result of ad fraud and configure the fraud validation rules to remove such installs from attribution.
You can configure the fraud validation rules based on the Abnormal Installs Report, using information such as device ID, OS name and version, country, etc., to handle abnormal installs in the ad performance measurement process. You can mark them as fraud, exclude them from postbacks, or remove them from the attribution process entirely.
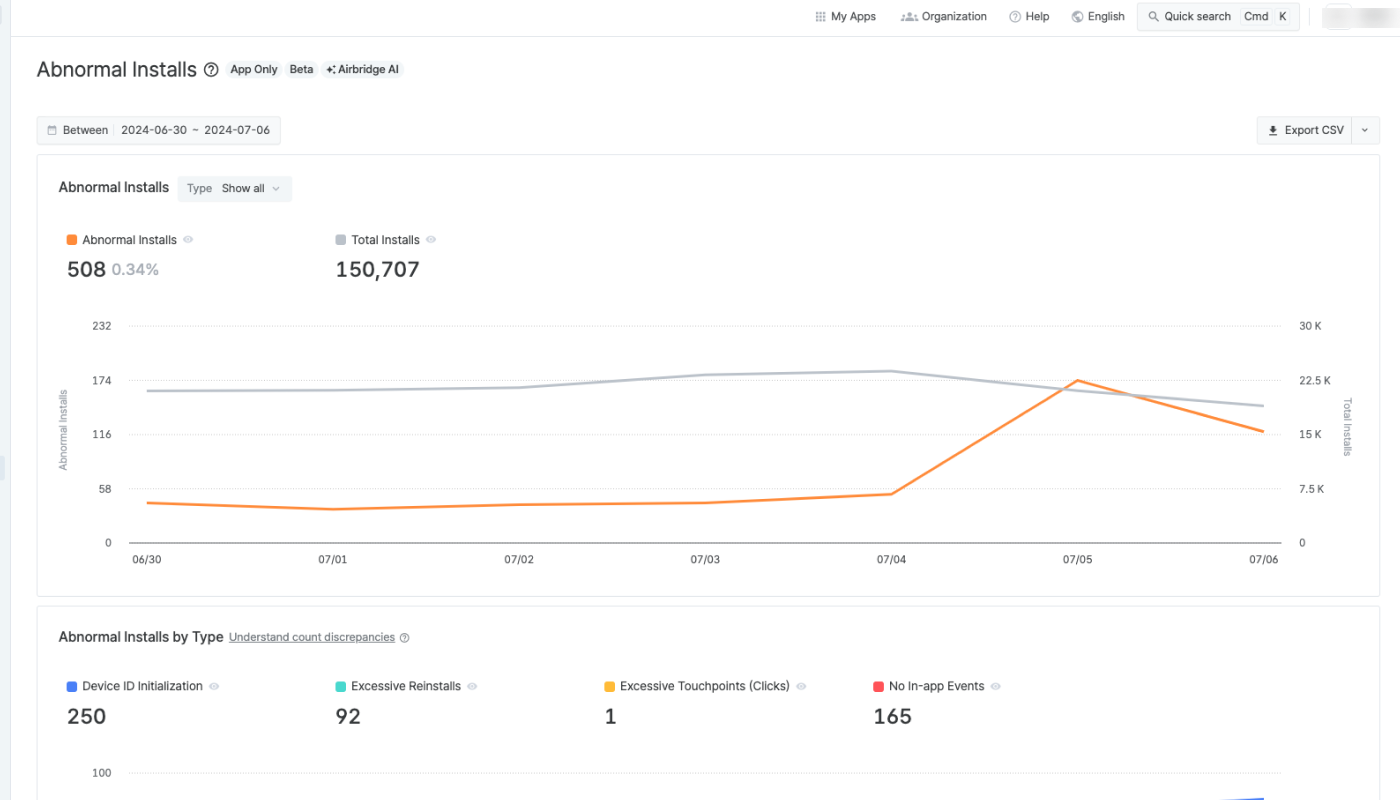
We recommend looking closer into the data when the total installs and abnormal installs show the opposite trend in the chart. For example, in the chart below, you can see that the total installs are trending downward, whereas the abnormal installs are trending upward starting from July 4. Check the types of abnormal installs that occurred and the campaigns that were run to figure out the causes and take proper actions.

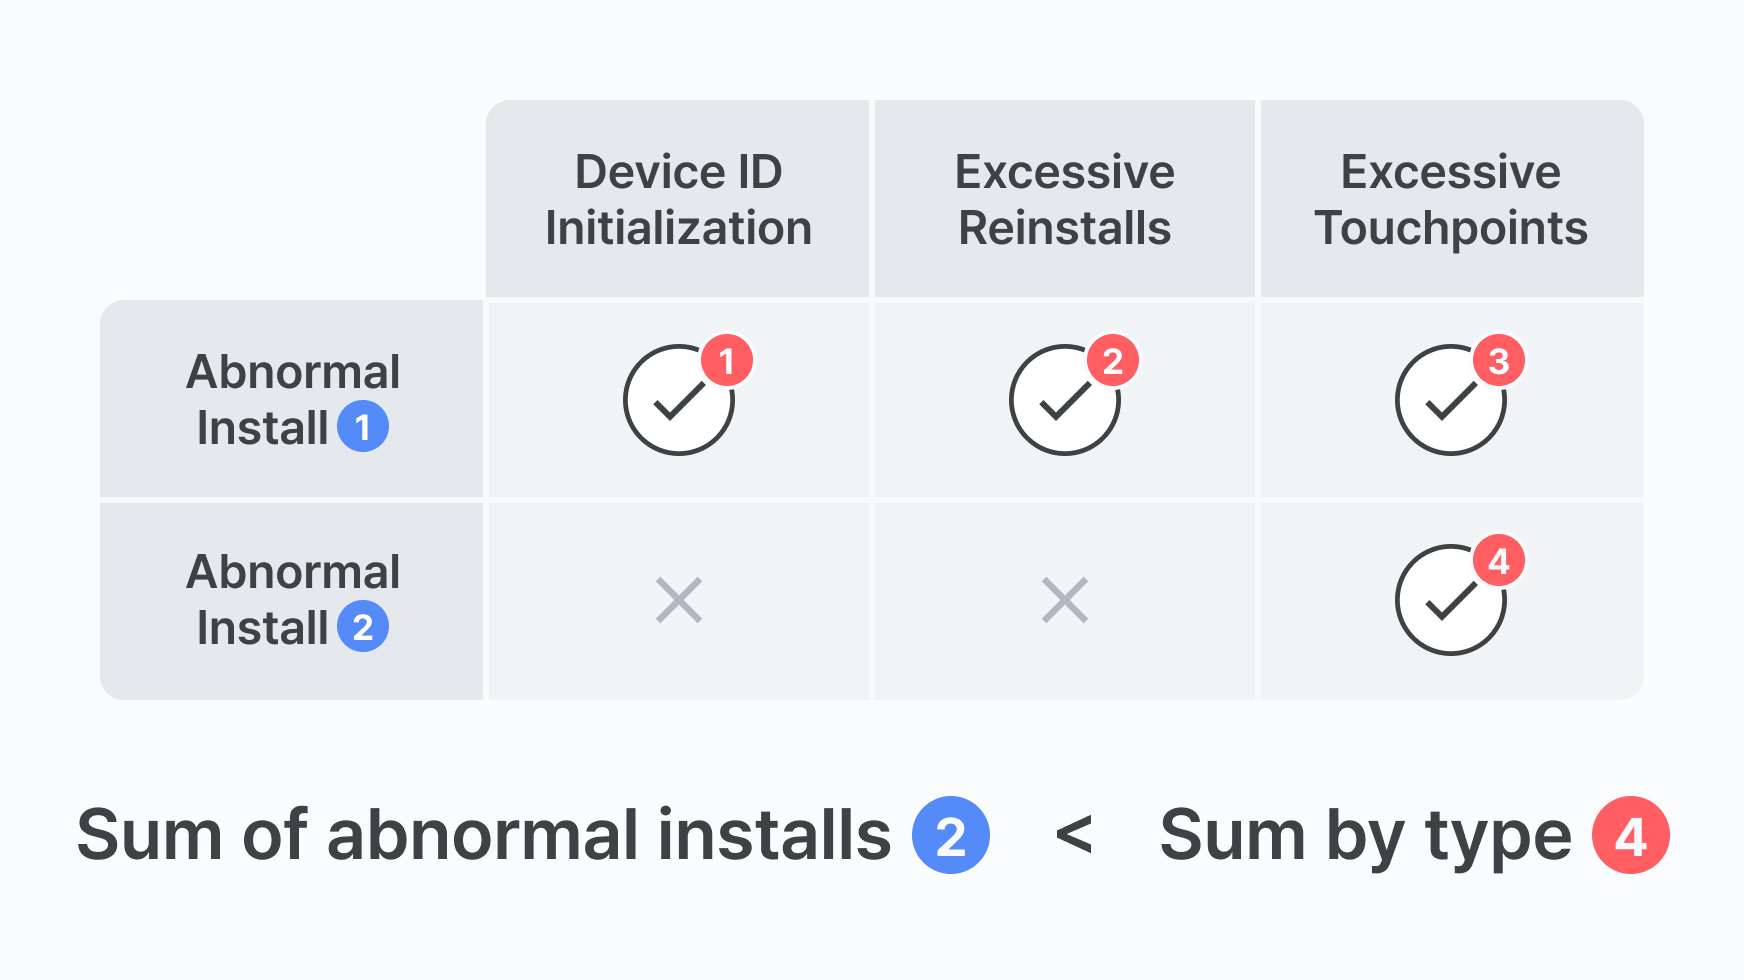
Abnormal installs can overlap across multiple types. This means that the sum of abnormal install counts by type may exceed the total number of abnormal installs. Refer to the image below.

No. The channels in the Channel field are the channels that have won the attribution credits for the installs based on the Airbridge attribution model. If “Excessive Touchpoint (Clicks)” is TRUE, it means that 10 or more touchpoints were collected from various channels, including the channel that appears in the Channel field.
Note that the more installs driven from a specific channel, the higher the likelihood of abnormal installs being reported. It is recommended to check the number of abnormal installs in relation to the total number of installs.
Was this helpful?