- Marketers Guide
- Reporting
- Funnel Analysis
Funnel Report Use Cases
Here are some use cases of the Airbridge Funnel Report you can refer to for your funnel analysis.
Let’s say you launched a new app in the global market. You want to know whether users successfully sign up and sign in after installing the app. You want to use the Airbridge Funnel Report to look deeper into the behavior of the users who installed the app and signed in within the last 10 days.
1. You don’t need to specify a cohort if you want to consider all users for the analysis.
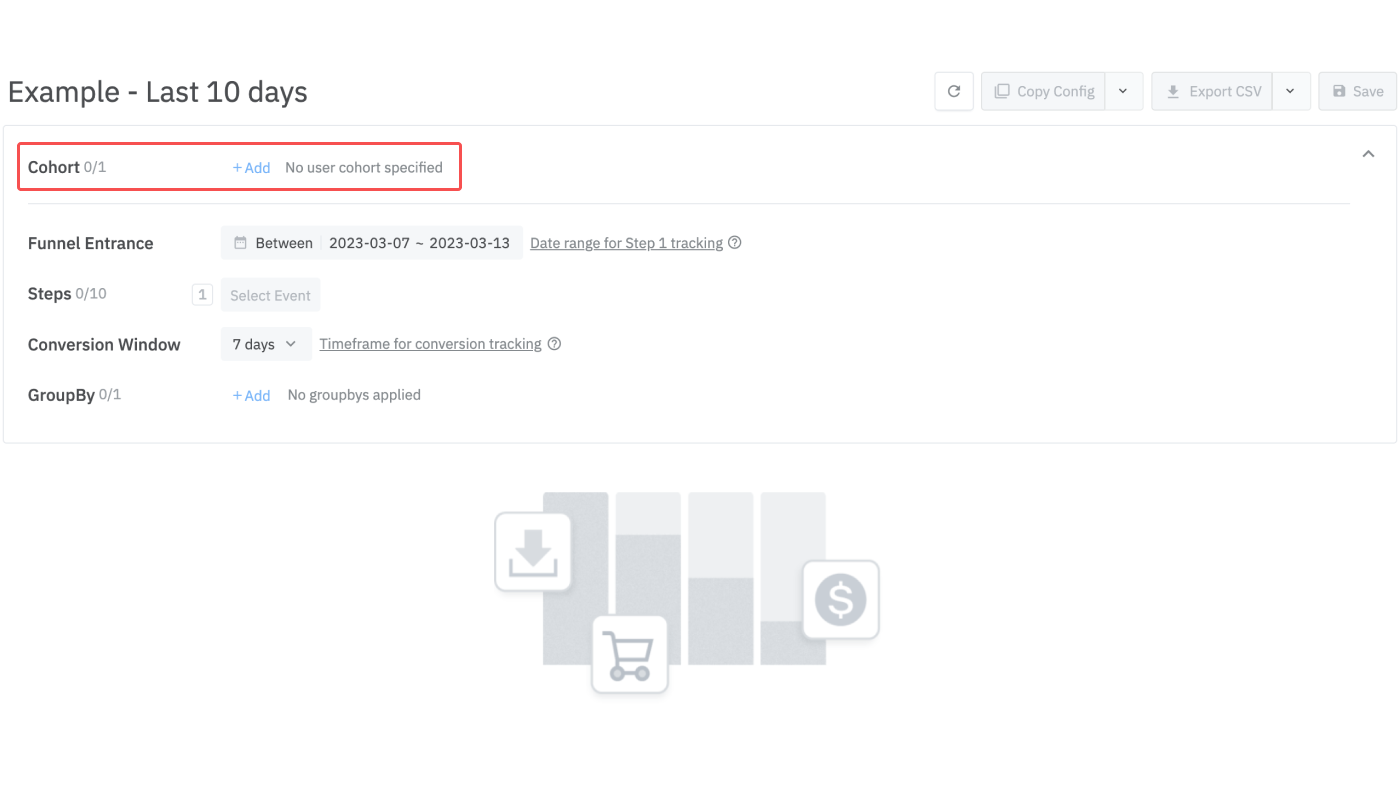
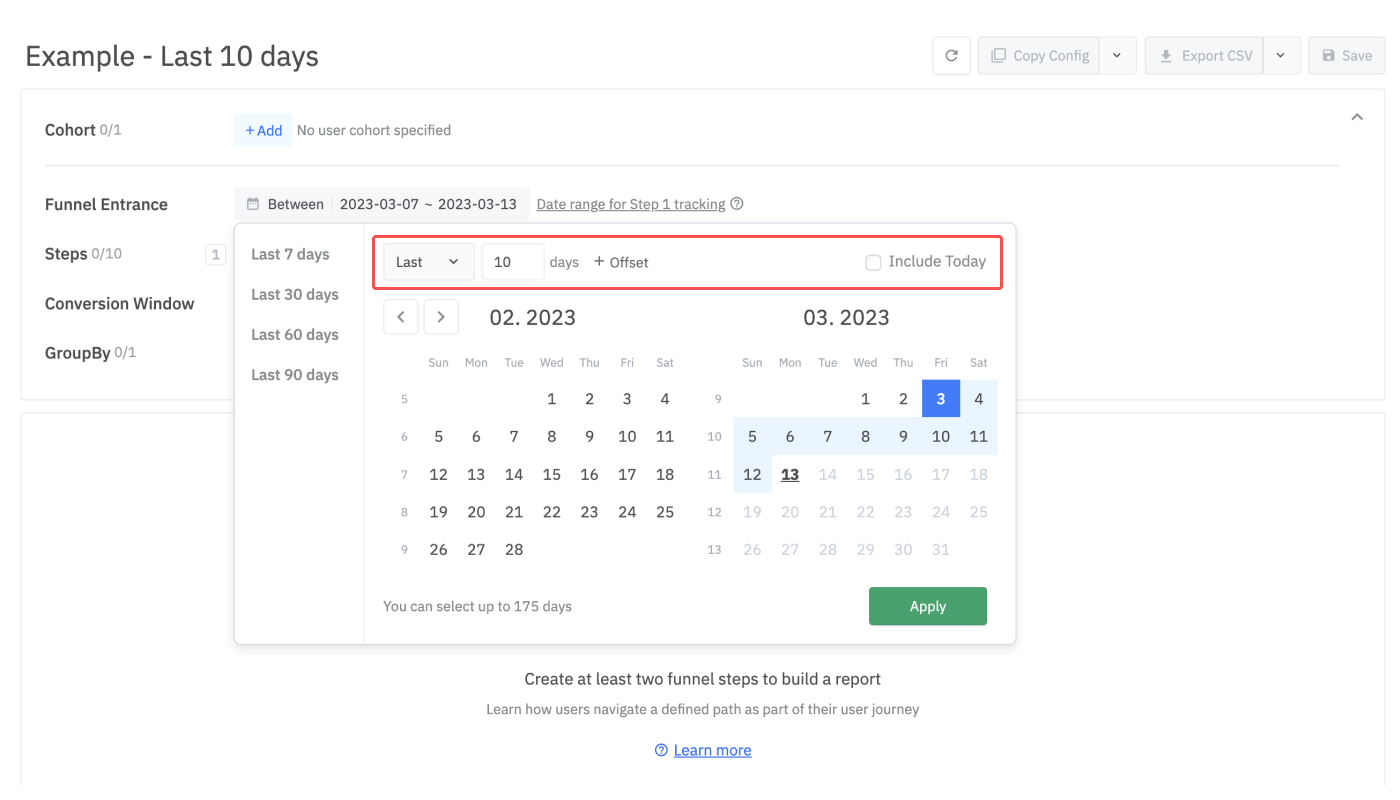
2. Set the [Funnel Entrance] date range as the last 10 days and check [Include Today].
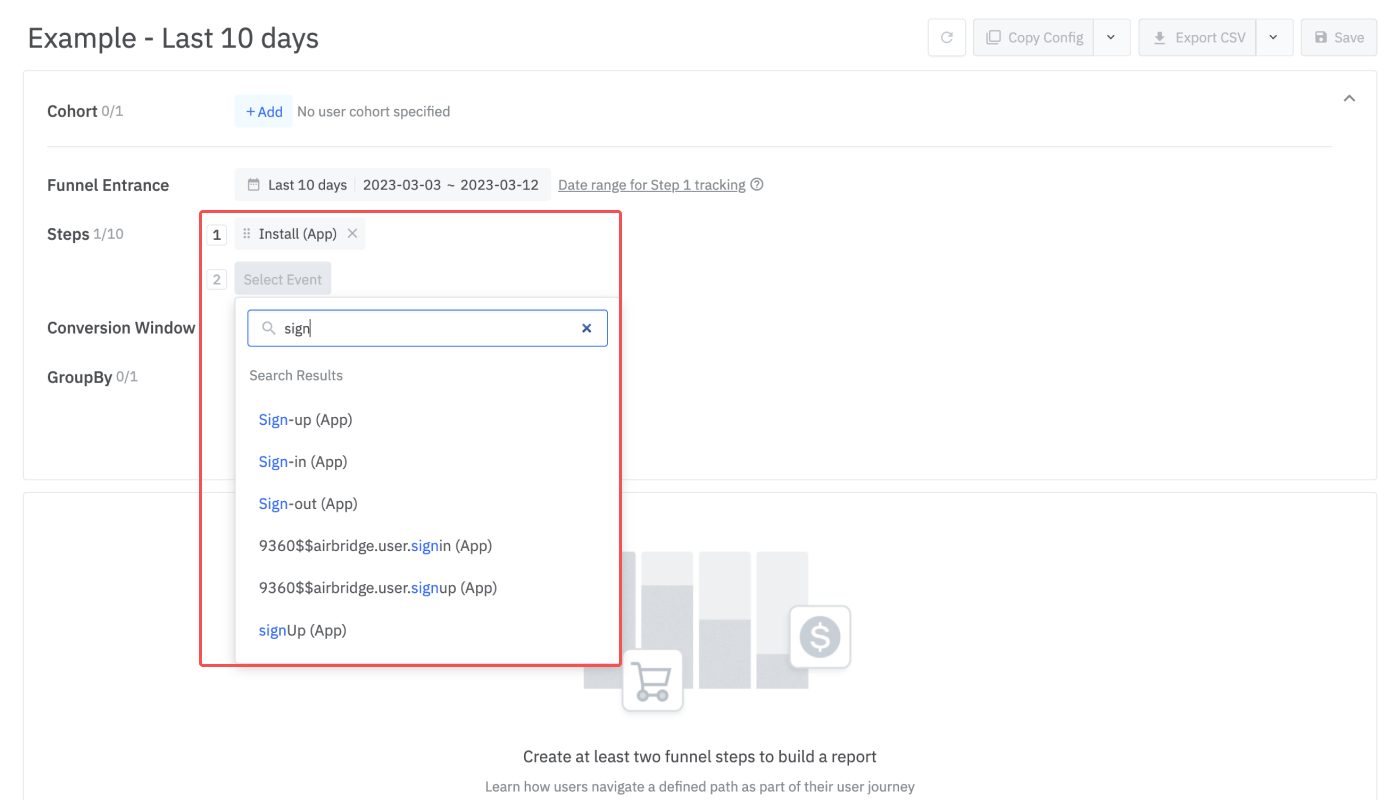
3. Select events for steps to create your funnel. In this case, Step 1 should be set to Install (App), and the last step should be Sign-in (App). You can select up to eight more Steps between Step 1 and the last, depending on how you want to create your funnel.
4. If you want to track the users who signed up and signed in from the home screen, you have to create the Steps like this:
Install (App) - Home Screen (App) - Sign-up (App) - Sign-in (App)
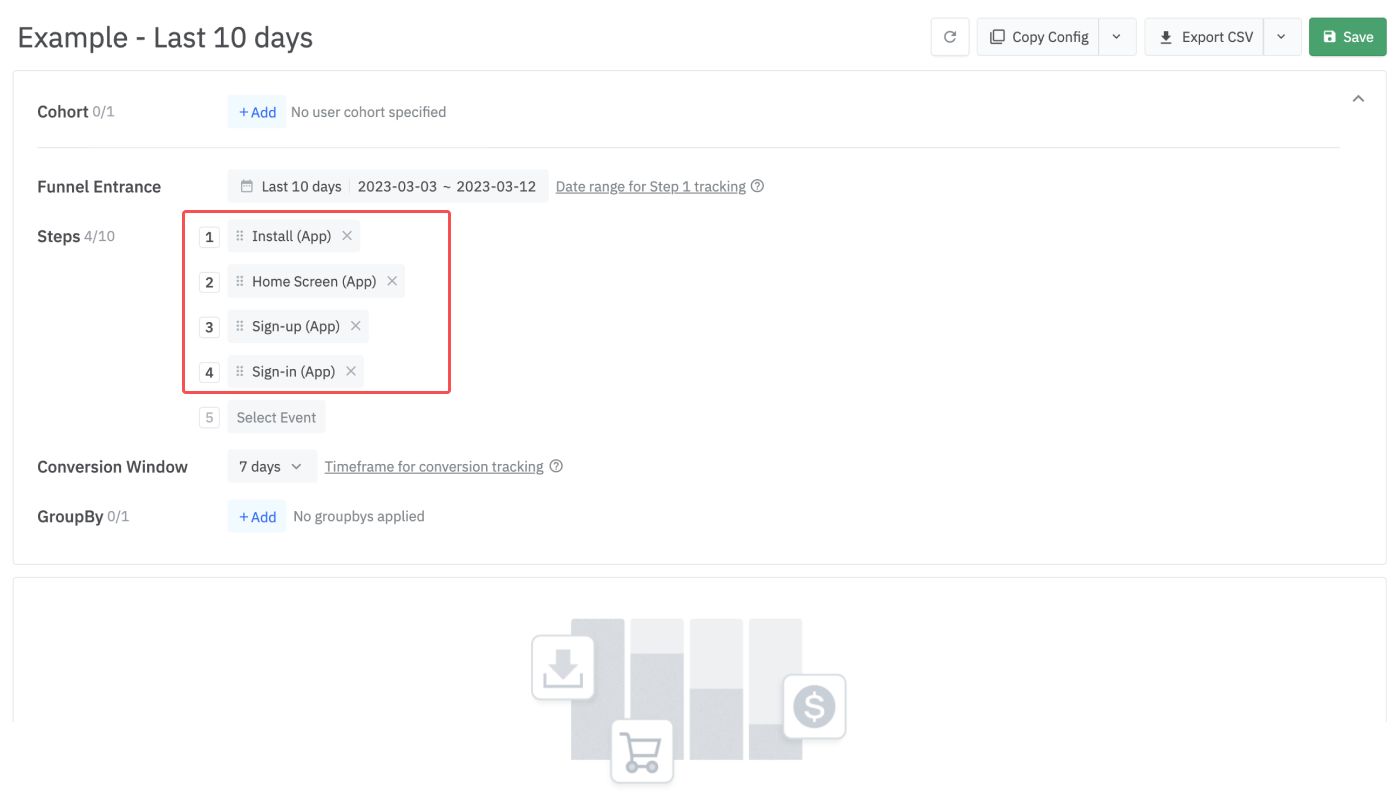
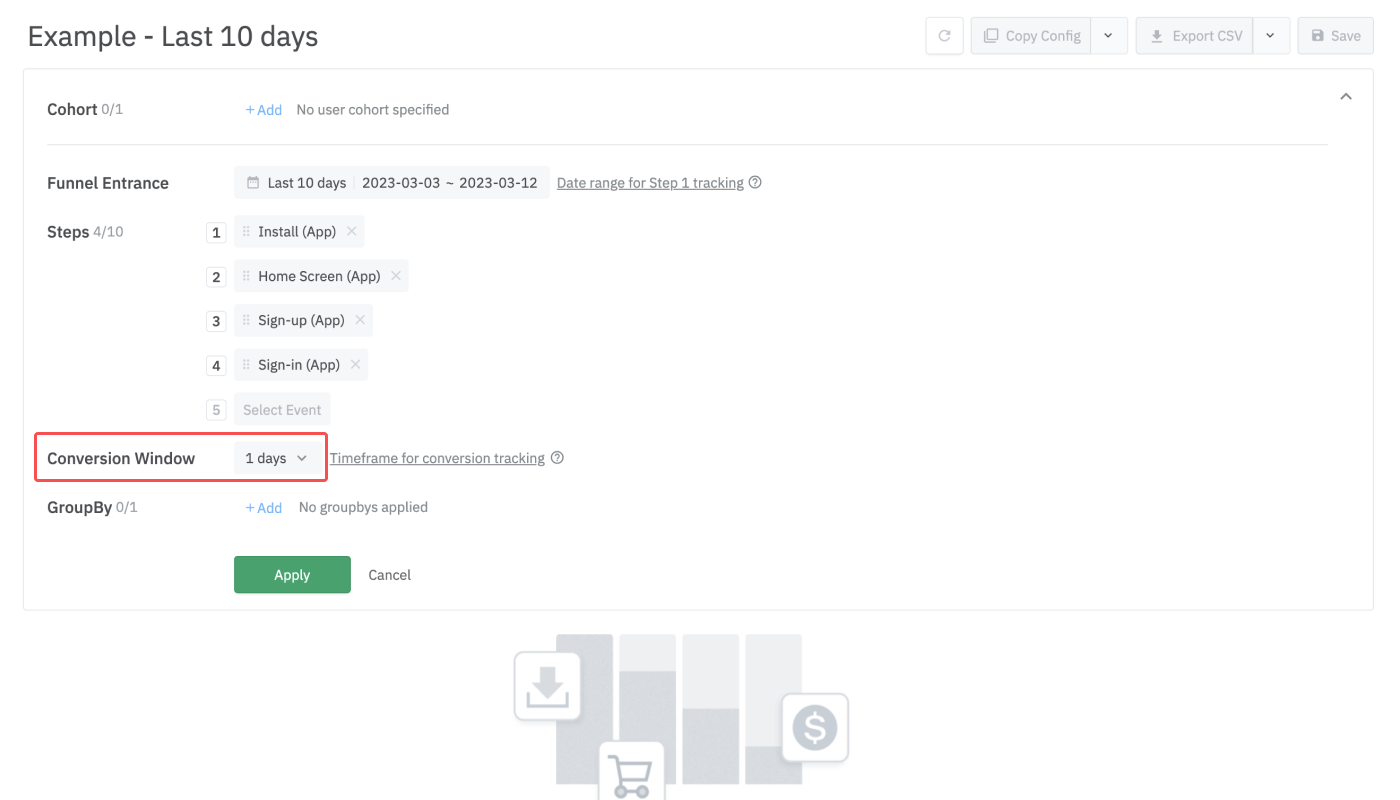
5. Let’s say you want to see how many people installed the app, signed up, and signed in to your app on the same day. In this case, the [Conversion Window] should be set to 1 day.
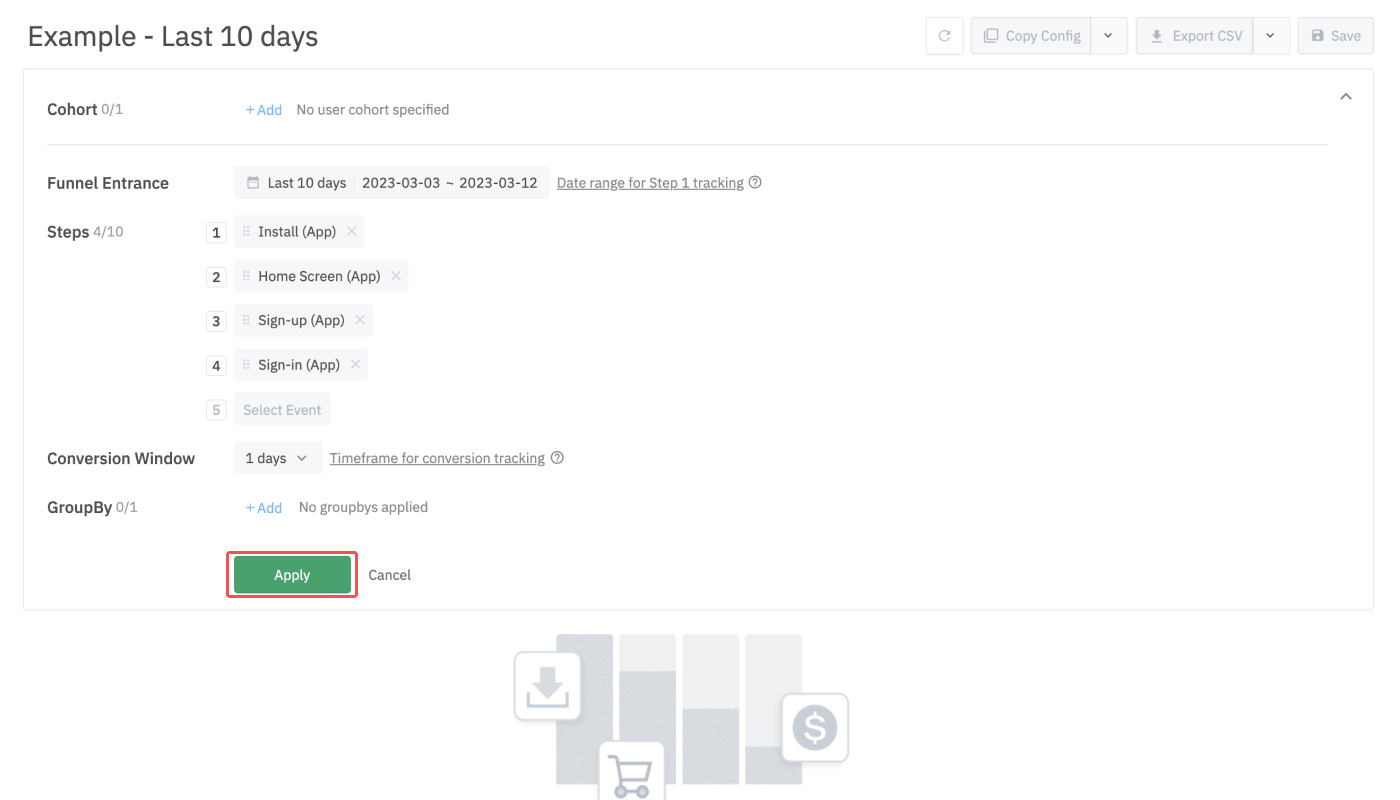
6. You don’t need to select a GroupBy option in this example. Click Apply to view the report. If you want to reopen this report, click Save to import the same report settings.
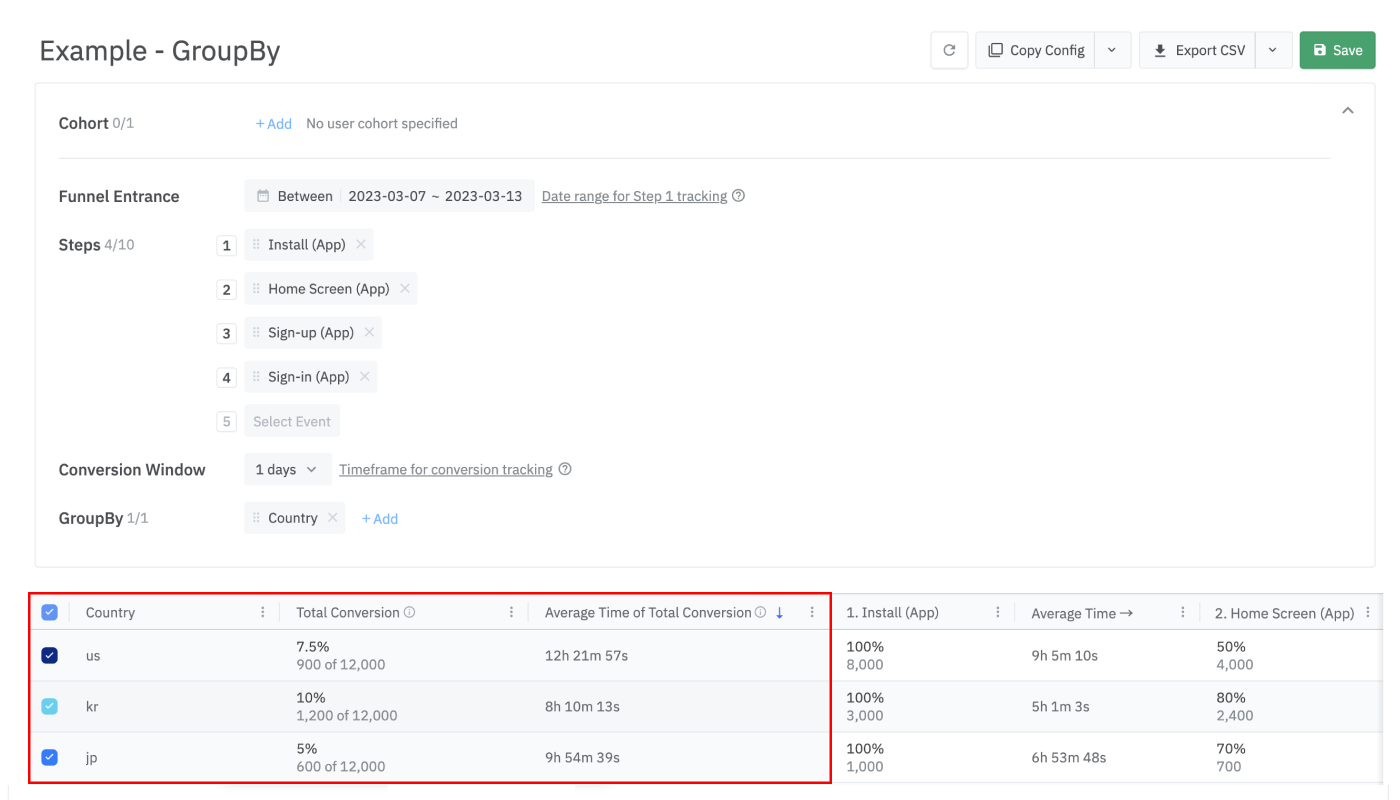
You may need to get more granular to create a robust marketing strategy based on the data you get from the report you created by following the steps above. To analyze the user journeys by country, follow the steps below.
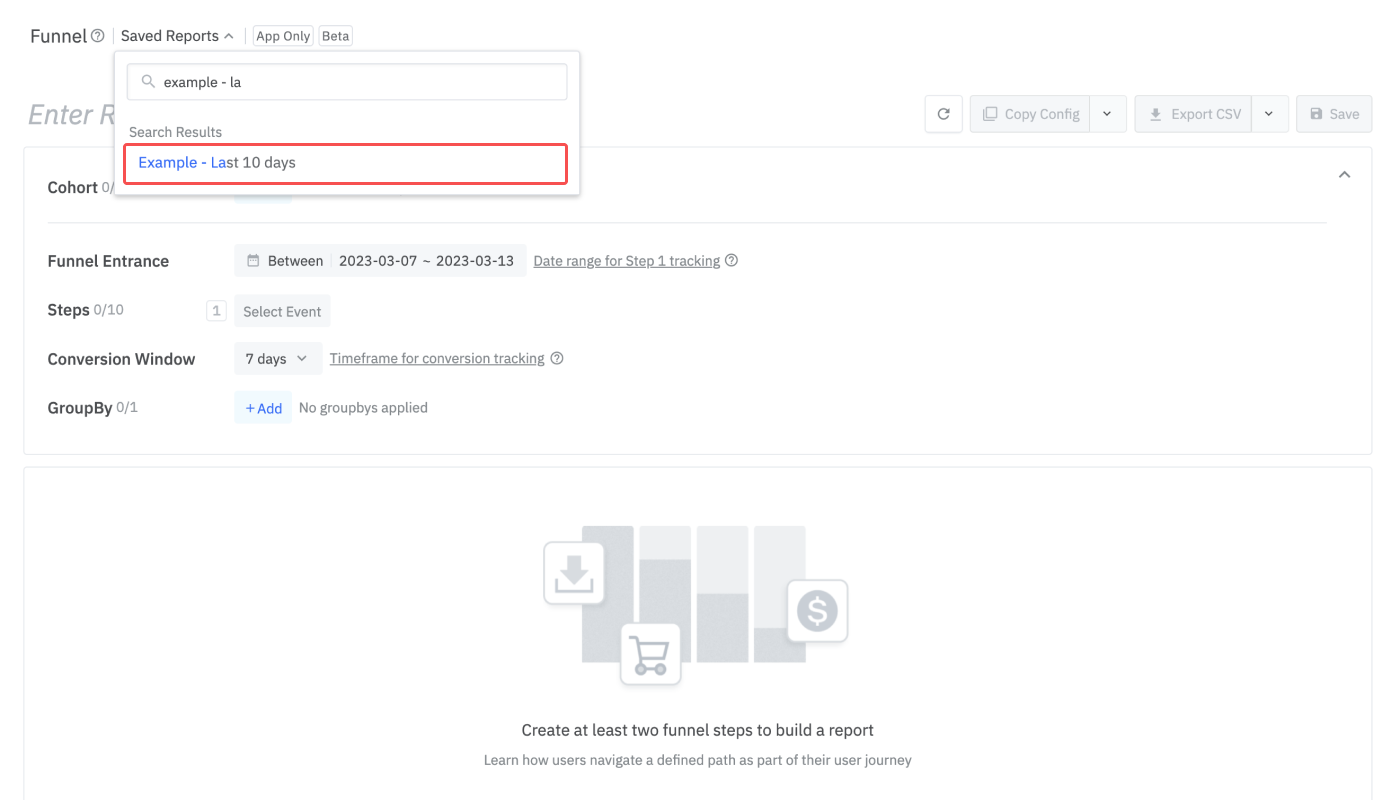
1. Import the saved report. If you didn’t save the report, scroll up and create the report again by following the steps in this section from the start.
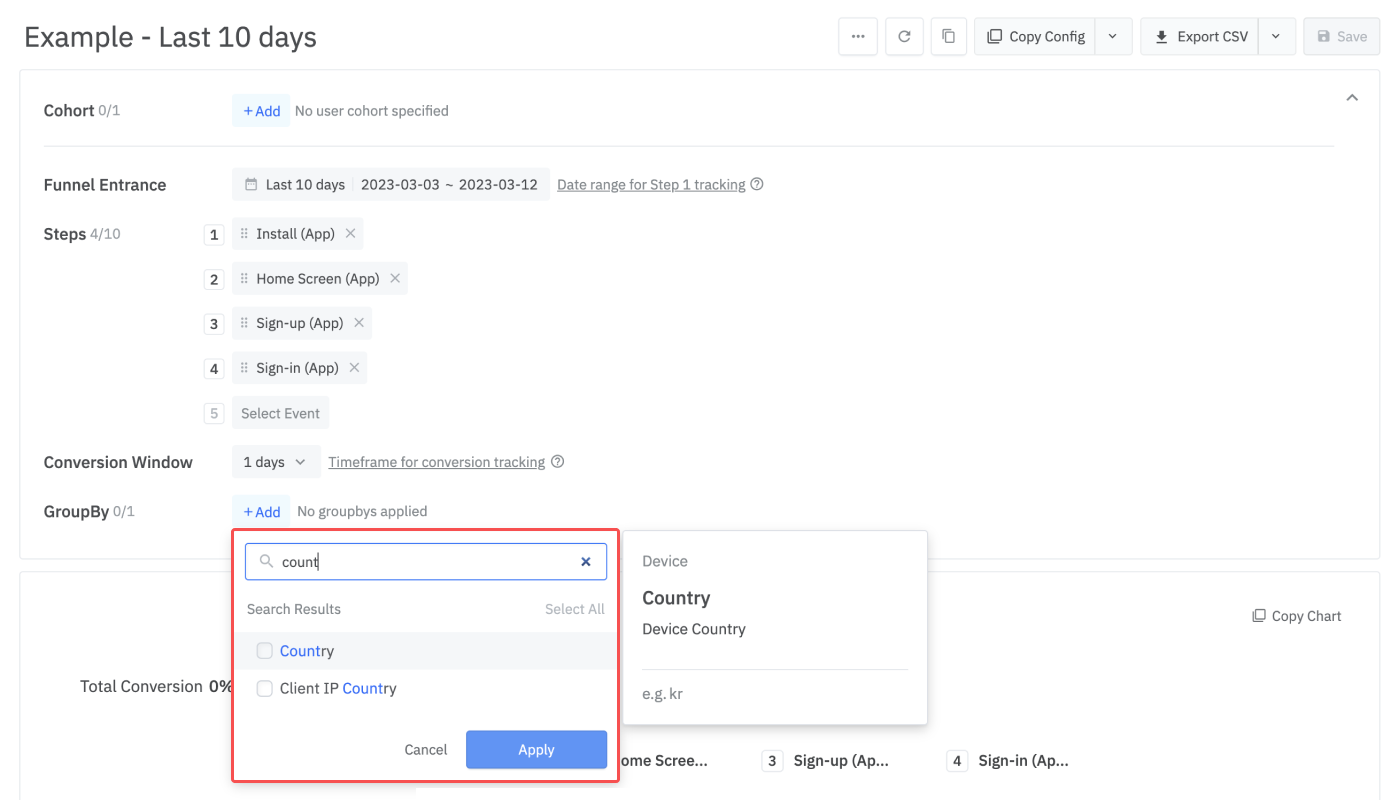
2. Select Country from the GroupBy options. Click Apply to view the data by country.
3. In the table, you can see the Average Conversion Time of each user group by country. This helps you understand which Steps take a long time for users to convert and how the time to convert differs by country. Using this information, you can fine-tune global marketing strategies to boost conversion rates.
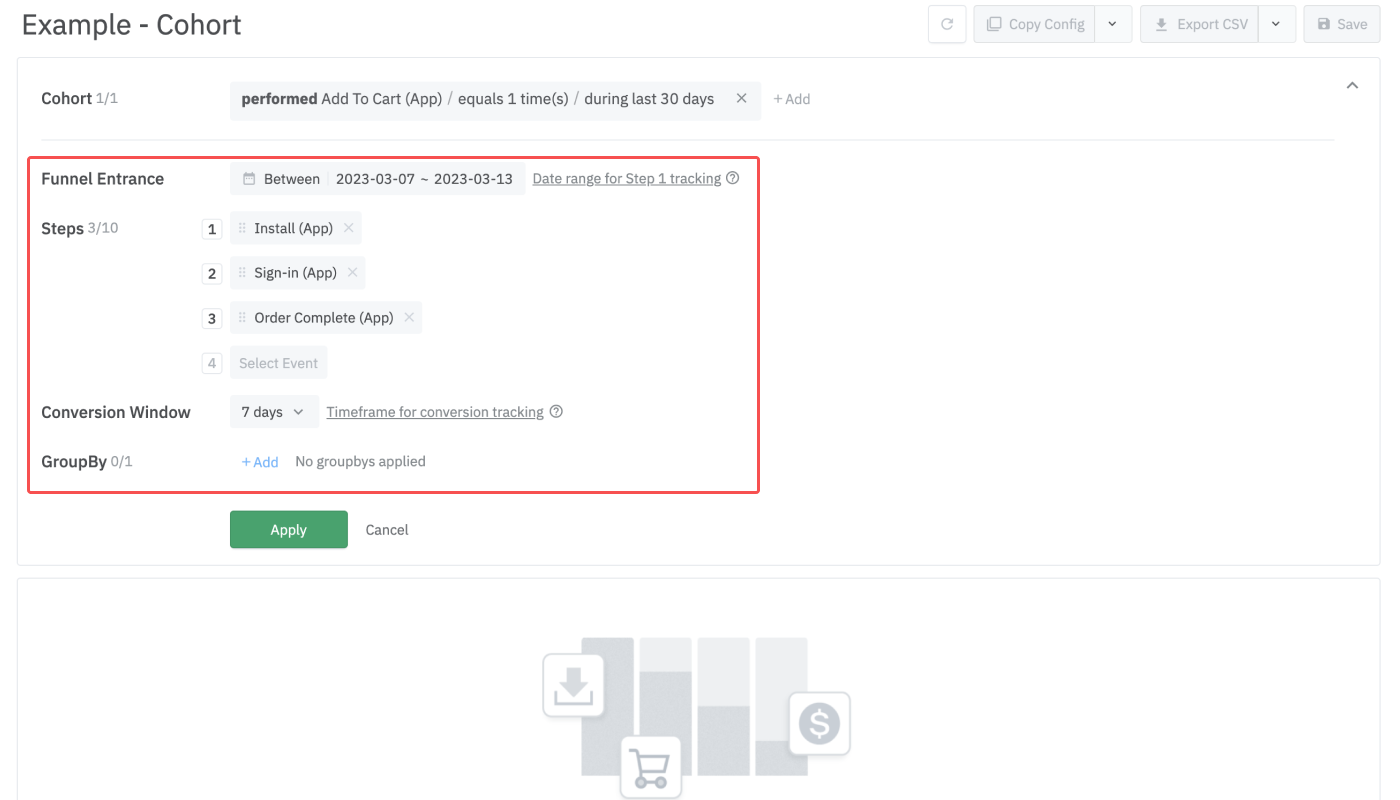
Let’s say you want to see how many users complete a purchase after viewing the products and adding them to their cart. You can do that by creating a funnel consisting of Steps defined as Product View (App), Add To Cart (App), and Order Complete (App).
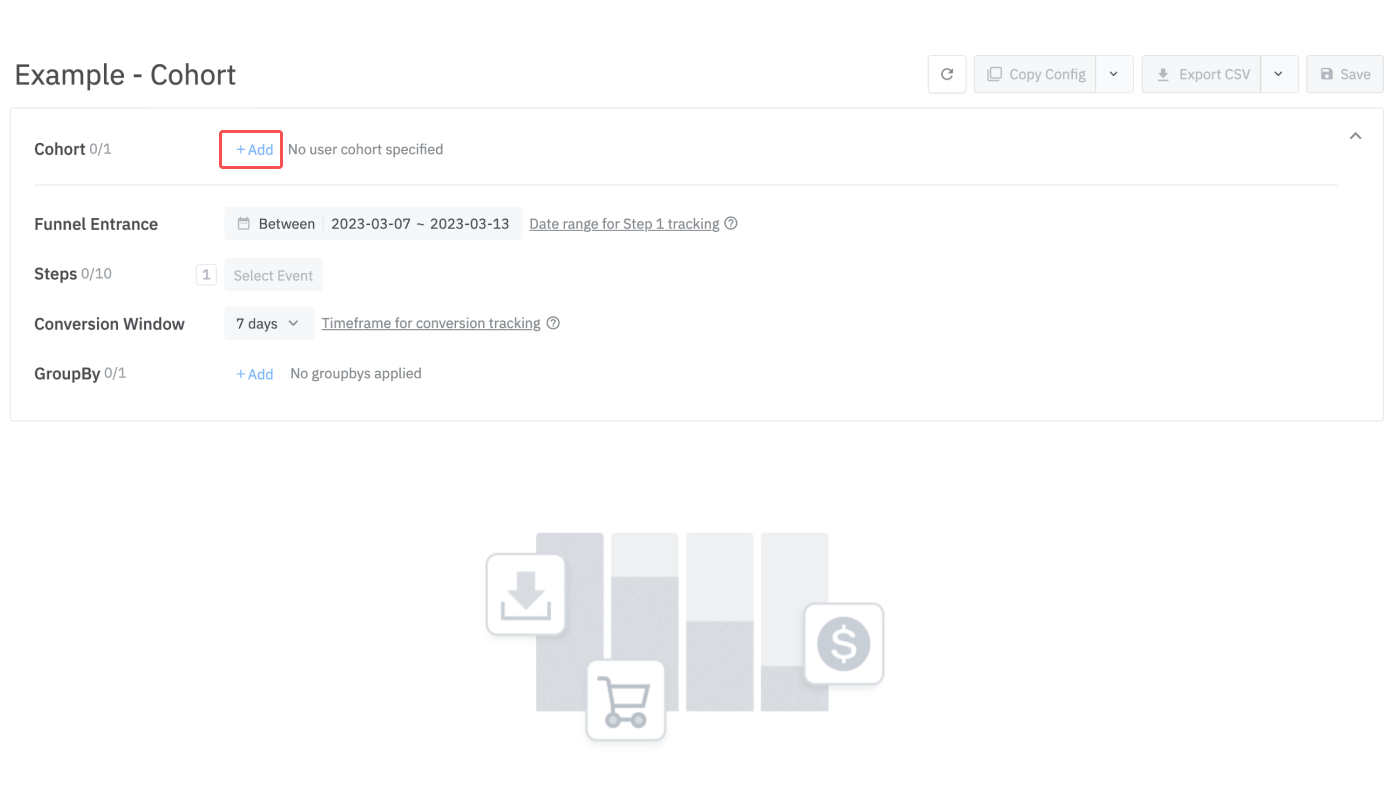
You can get more granular by specifying a cohort. For example, you can find out whether users who added products to their carts in the last 30 days have a higher conversion rate than those who didn’t.
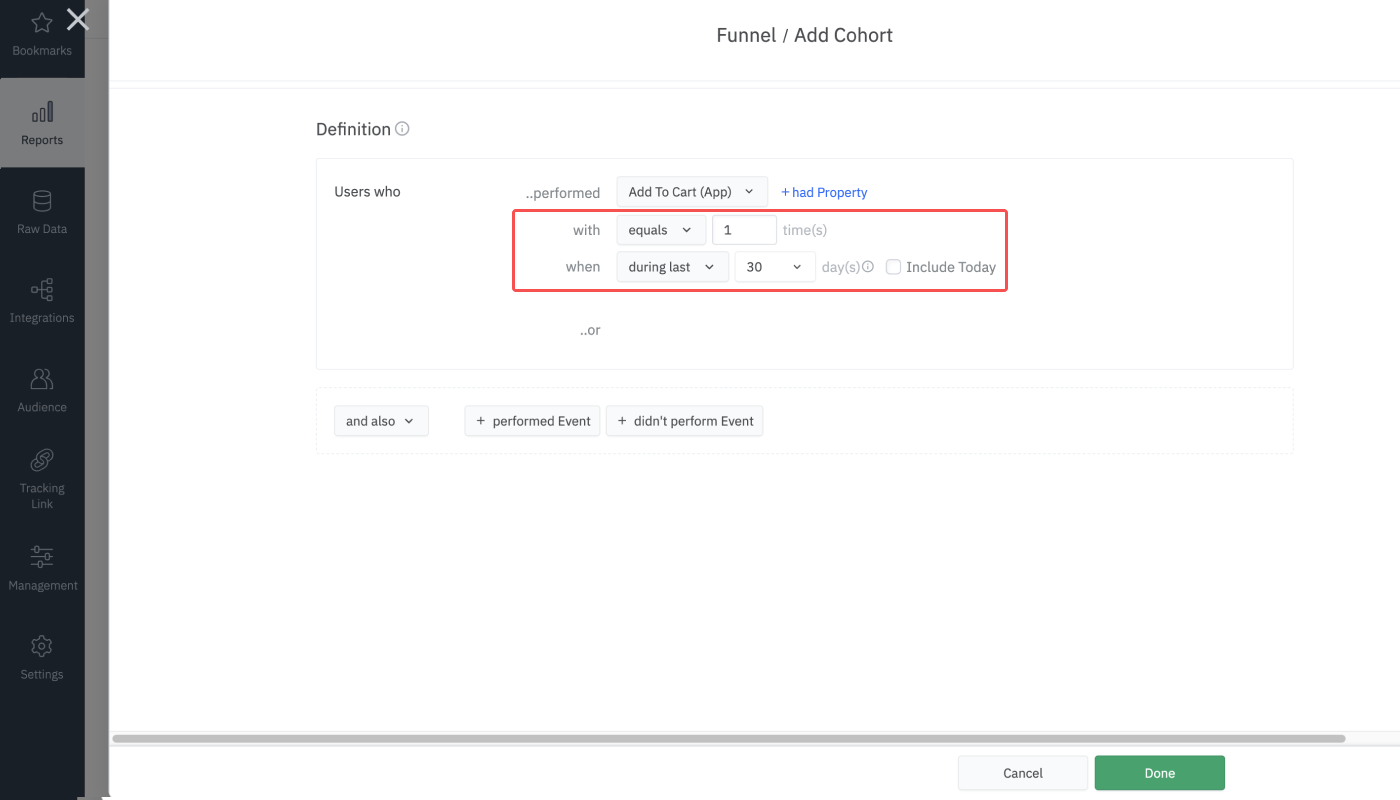
1. Click + Add next to the [Cohort] menu in the configuration box.
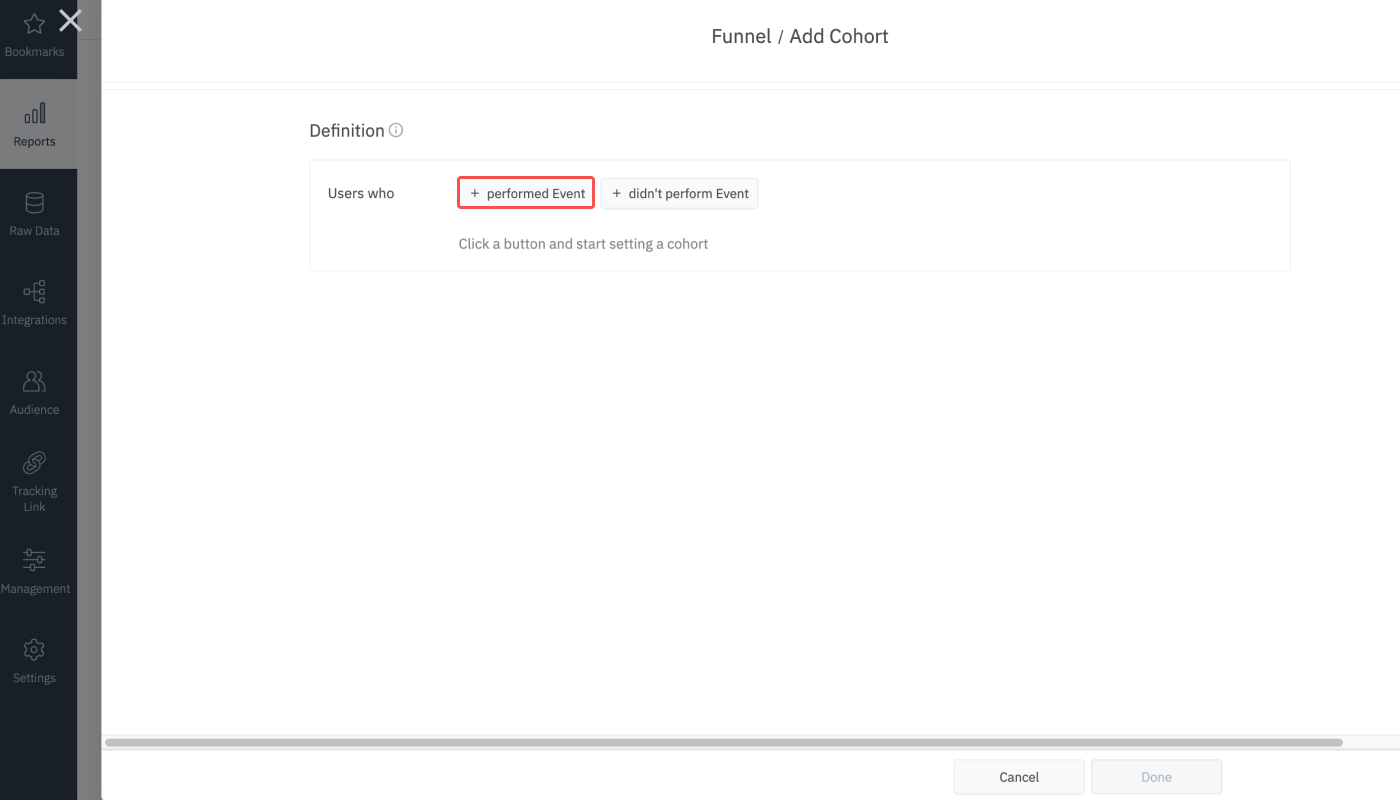
2. Click performed Event.
3. Select Add to cart (App) event from the drop-down list. To add properties to this event, click + had Property.
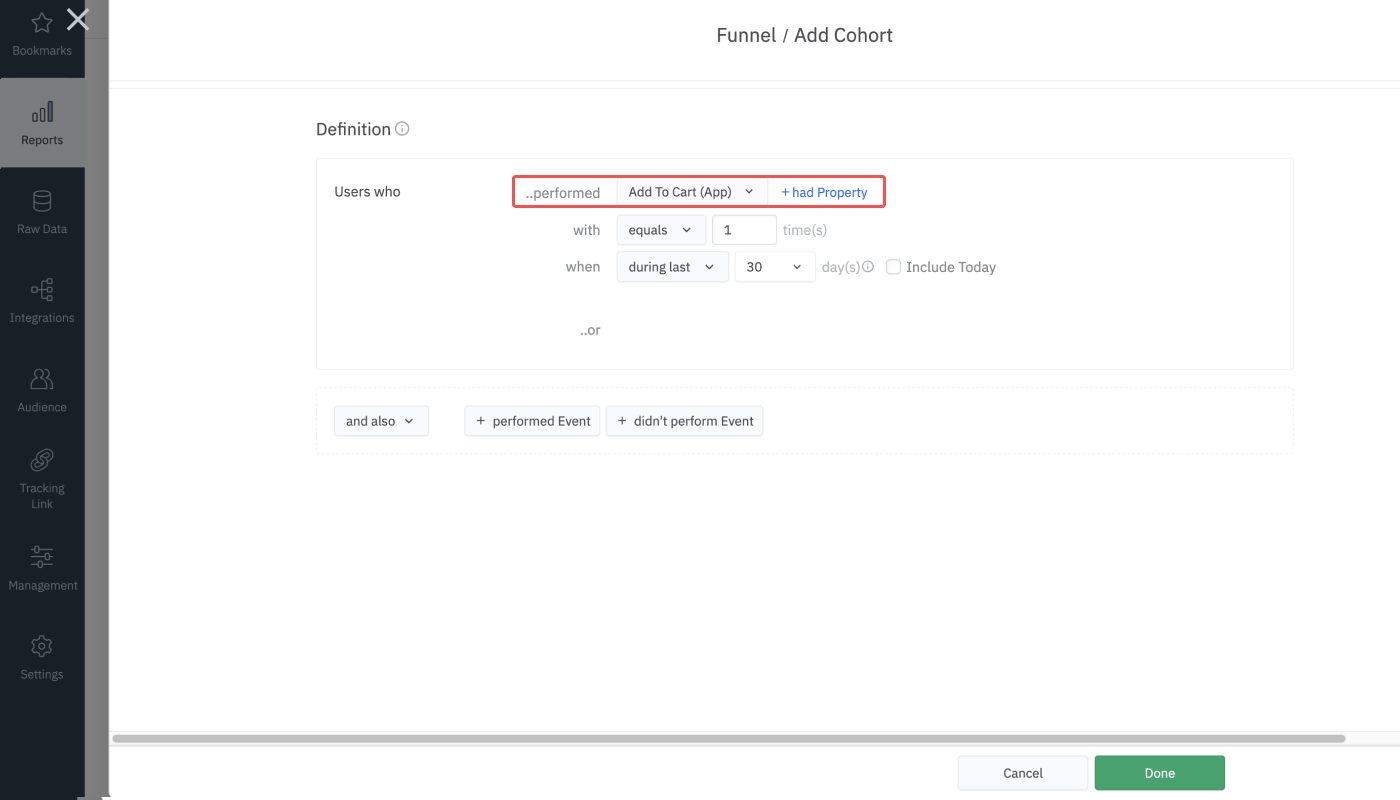
4. You can also set the number of event occurrences or the period of the event occurrences. Let’s say you want to see the data of users who performed the Add to cart (App) event more than once in the last 30 days. To do that, you need to select more than or equals and enter 1 time, select during last and enter 30 days. Then click Done.
5. Once you complete the settings for creating the funnel, click Apply.
6. Adding a GroupBy option allows you to compare the data across various user groups within the cohort data.
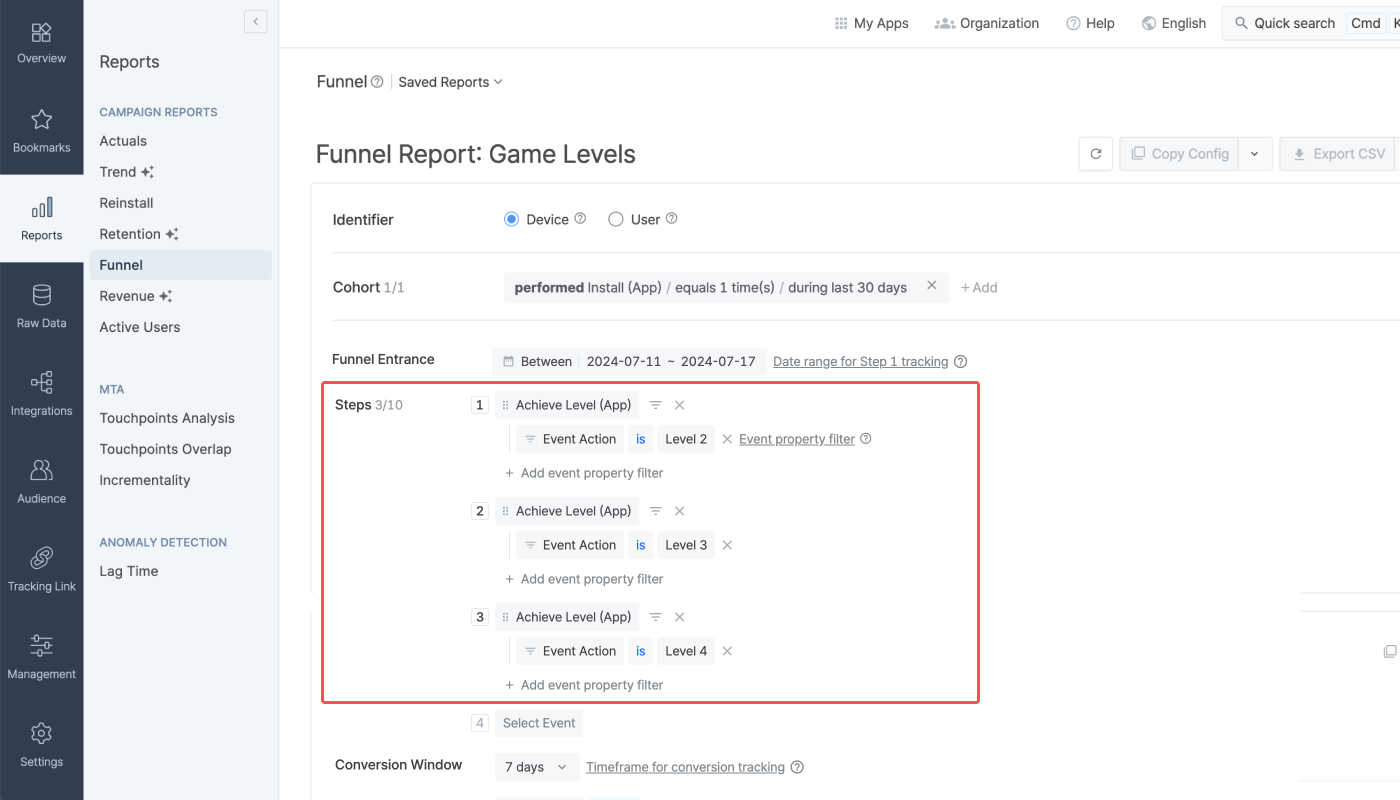
Let’s say you want to find out where the users most drop off from your game. You can specify the user journey within the game by configuring the steps as game levels using event property filters.
1. Configure the cohort and the funnel entrance date range to fit the analysis objective.

2. Configure steps 1 to 3 as the Achieved Level (App) event and add event property filters, as shown in the following image.
3. Configure the conversion window and GroupBy to fit the analysis objective. Use GroupBy options to study the user journey by different variants, such as ad channels, campaigns, creatives, etc.
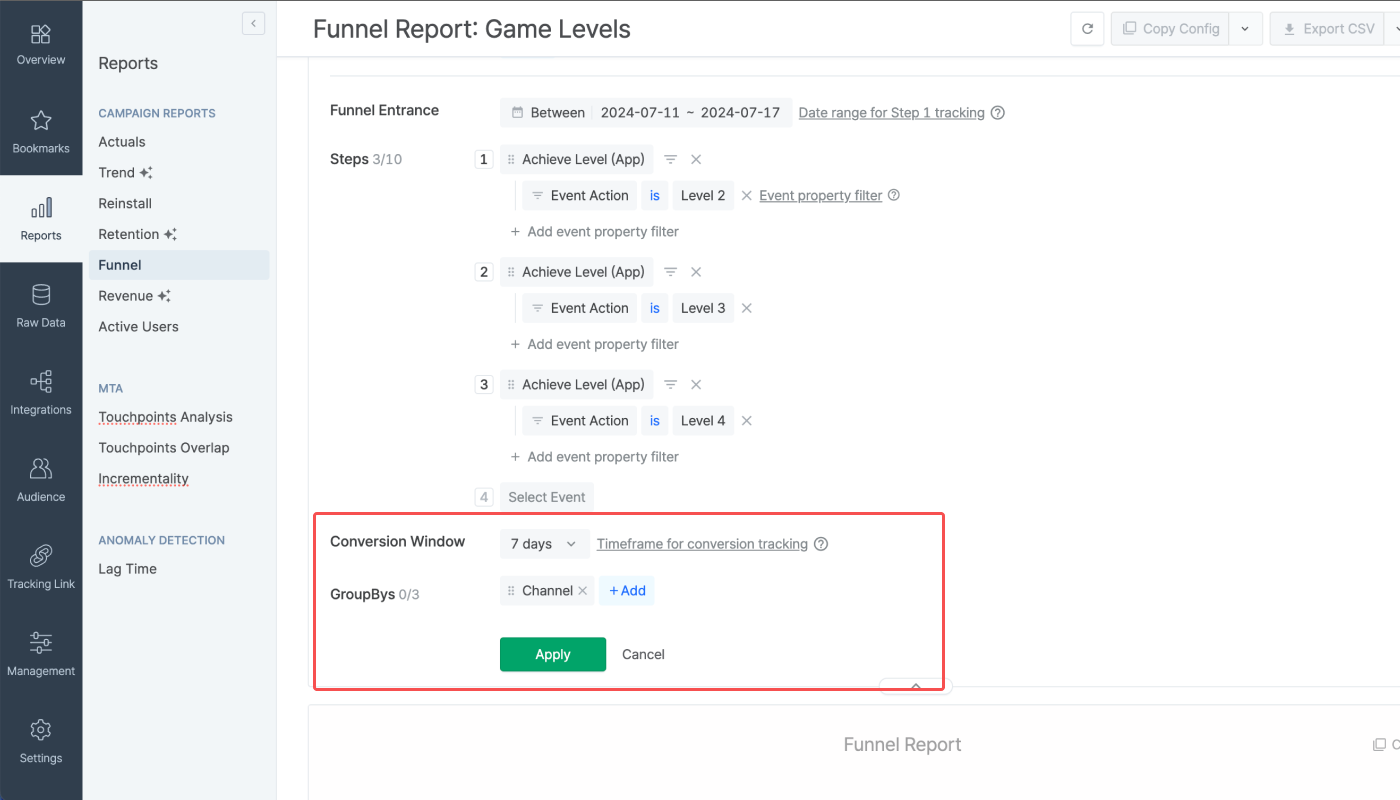
4. Click Apply to view the report. Save the report so it can be opened again in the future.
Was this helpful?