Overview Dashboard
The Overview Dashboard is your customizable go-to dashboard for daily app growth monitoring, allowing you to track the key metrics of all your apps at a glance in real-time.
The Overview Dashboard is available once your app is registered to Airbridge and the Airbridge SDK starts collecting campaign data. Your campaign performance can be visualized as widgets, charts, and tables for easy understanding at a glance.
To open the Overview Dashboard, click My Apps on the top menu bar and click Overview Dashboard, or select [Overview] from the sidebar.
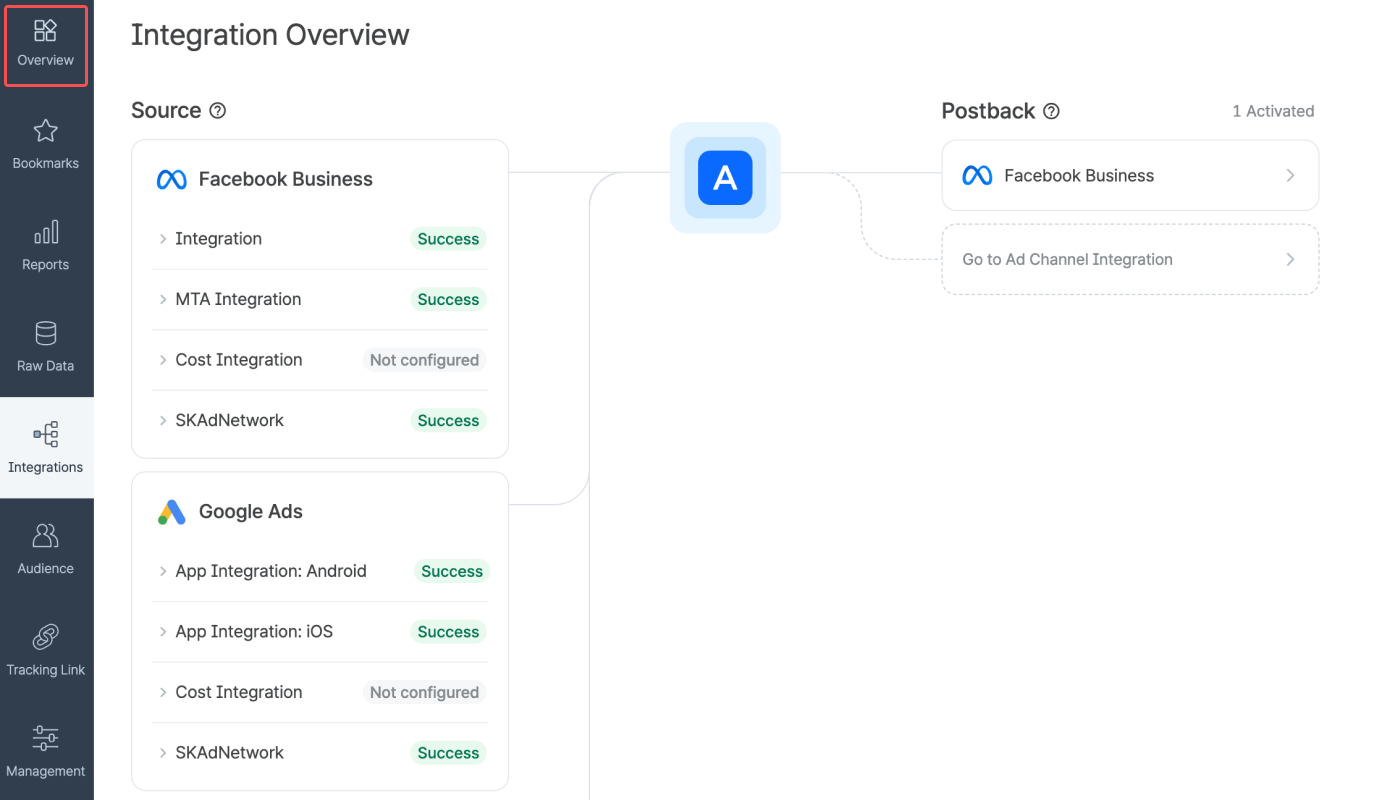
If you are unable to see the desired data in the Overview Dashboard, check your app role and the data access permissions first.
Note
The Overview Dashboard displays real-time data. User count-related metrics and cost-related metrics are updated according to the fixed update cycle.
Select the organization to view the data of the app registered to the organization. Then, set the time zone and the date range for the data you want to visualize in the dashboard. Up to 31 days can be selected.
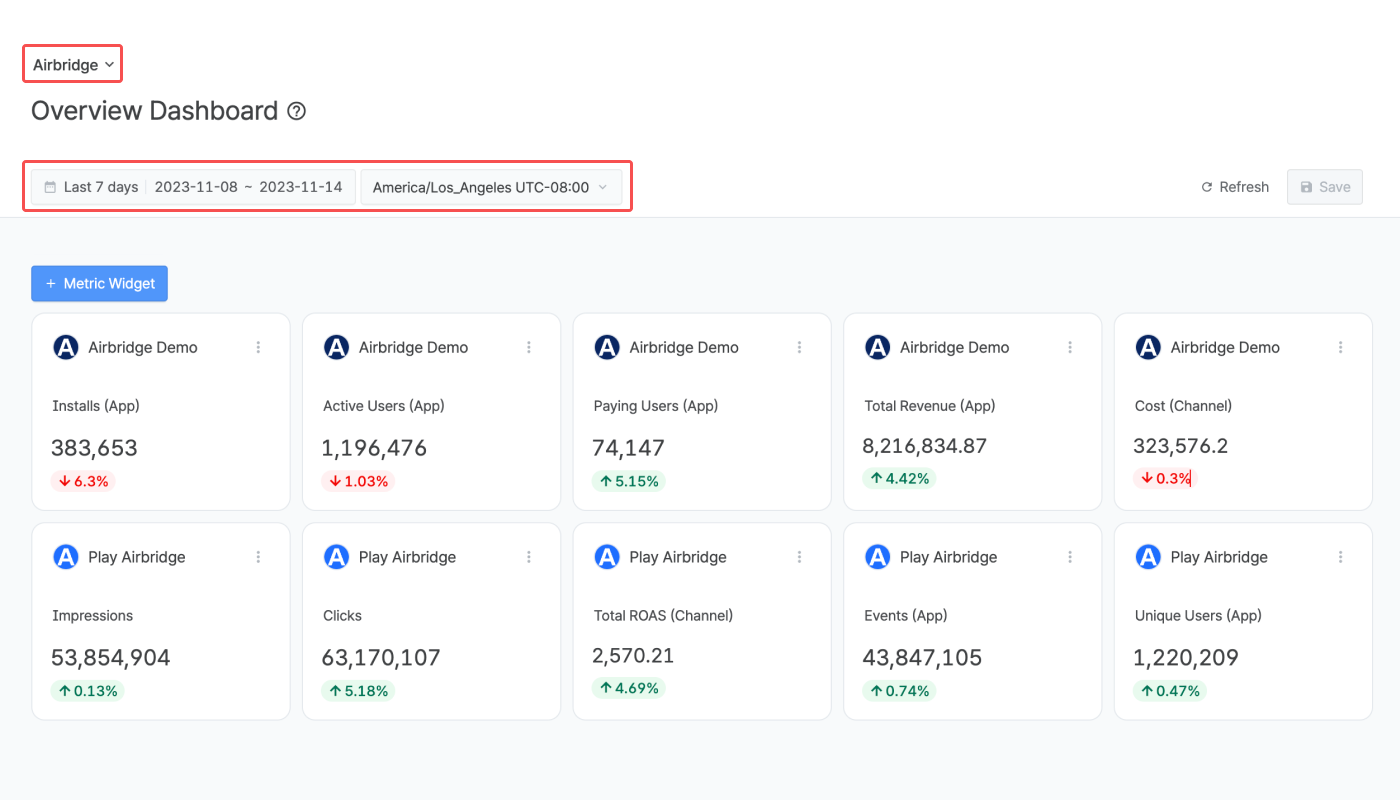
The date range can be set using the following conditions.
Condition | Date Range |
|---|---|
Between | From start date to end date |
Since | From start date to today |
Last | Last n days/weeks/months until yesterday |
When using “Last,” options such as “Include today,” “Include this month,” and “Offset” can be added.
For example, if you select Last 30 days and add Offset + 3 days, the date range will start 33 days before today and end 4 days before today.
You can create widgets that show the key metrics of the apps registered to the selected organization.

Note that metrics appear in the metric selector and are available for use only after the relevant data is collected by Airbridge. For more information about metrics, refer to this article.
Note
In the Overview Dashboard, all metrics, whether defined at the app level or the organization level, are available. Pay attention when using metrics defined at the app level and have varying definitions across apps within the organization.
For more information, refer to this article.
App metric value
The rate of increase or decrease in metric values compared to the previous date range (%)
The previous date range is automatically set to the same conditions as the set date range and can be viewed by hovering the mouse over the increase/decrease rate in the widget.
Refer to the examples below to understand how the previous date range for data comparison is set.
Set Date Range | Previous Date Range | |
|---|---|---|
Between | 5 days: 2023-01-10 to 2023-01-14 | 5 days: 2023-01-05 to 2023-01-09 |
Since | 10 days: 2023-11-01 to Today (2023-11-10) | 10 days: 2023-10-22 to 2023-10-31 |
Last | 3 days, including today: 2023-11-08 to Today (2023-11-10) | 3 days: 2023-11-05 to 2023-11-07 |
In the following cases, the increase/decrease rate in the widget is not provided:
When the previous date range for comparison is not available.
When the metric value is 0 in the previous date range.
Select an app.
Select a metric and add filters if necessary.
Click the “Done” button to add the new metric widget to the dashboard.
If you want to quickly change the metric of a widget, click the metric name on the widget card and select a different metric. To edit or delete the widget, click the [ellipsis] icon.
1. Click the […] icon on the metric widget you want to duplicate. Select Duplicate.
2. The metric widget is duplicated. You can change the metric or add filters.
If you want to get a more granular view of a metric, click the […] icon on the metric widget and select See in Actuals to see the data in the Actuals Report. The Actuals Report will open in a new tab with the same configuration set as in the metric widget, where you can add more GroupBys and Filters.
If the numbers in the Overview Dashboard are different from the numbers in the Actuals Report, click Refresh in the Overview Dashboard.
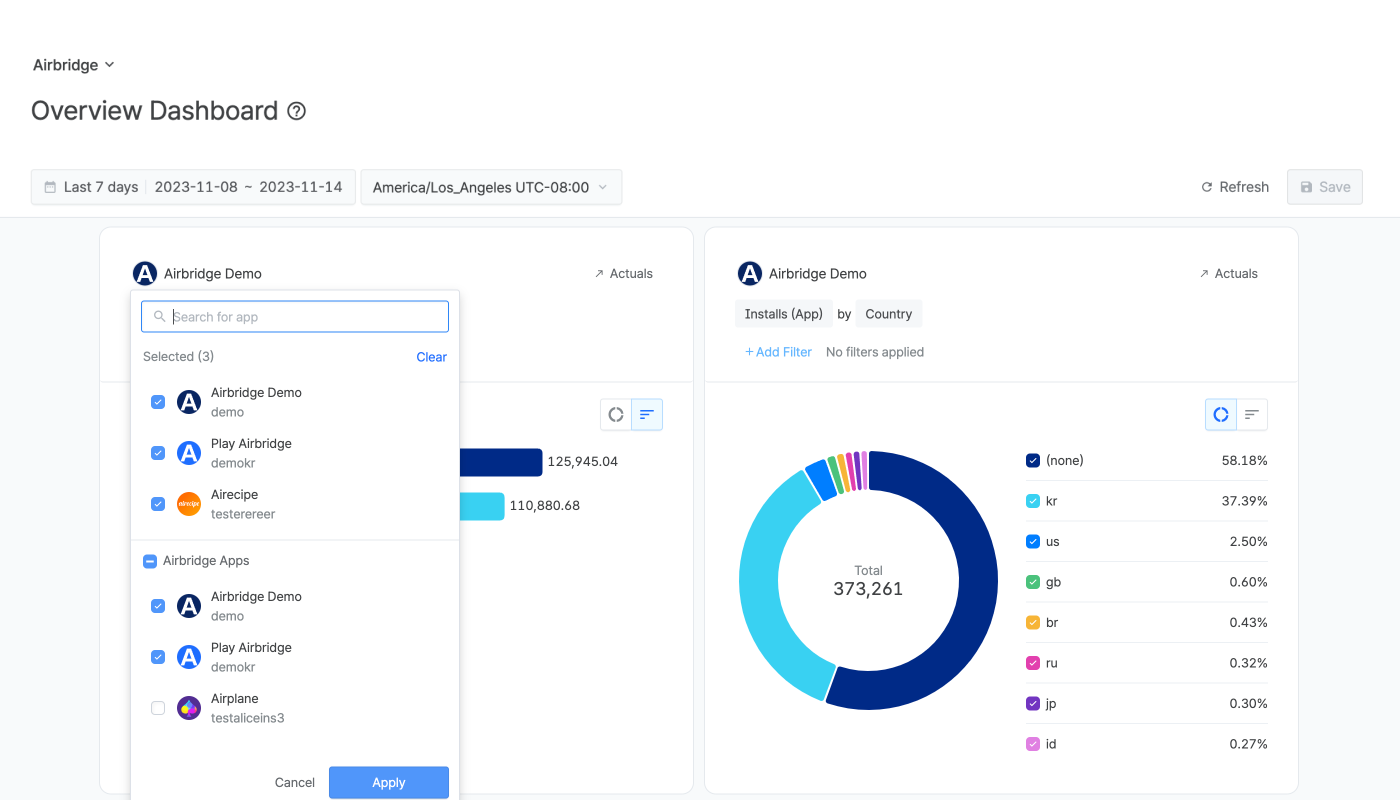
You can configure 6 charts and 1 table to view data of an app or multiple apps.
Note
In the Overview Dashboard, all metrics, whether defined at the app level or the organization level, are available. Pay attention when using metrics defined at the app level and have varying definitions across apps within the organization.
For more information, refer to this article.
You can configure 6 charts and 1 table. Data from multiple apps can be visualized in a single chart or table for comparison.
You can configure 2 charts in a stacked bar or line graph type.
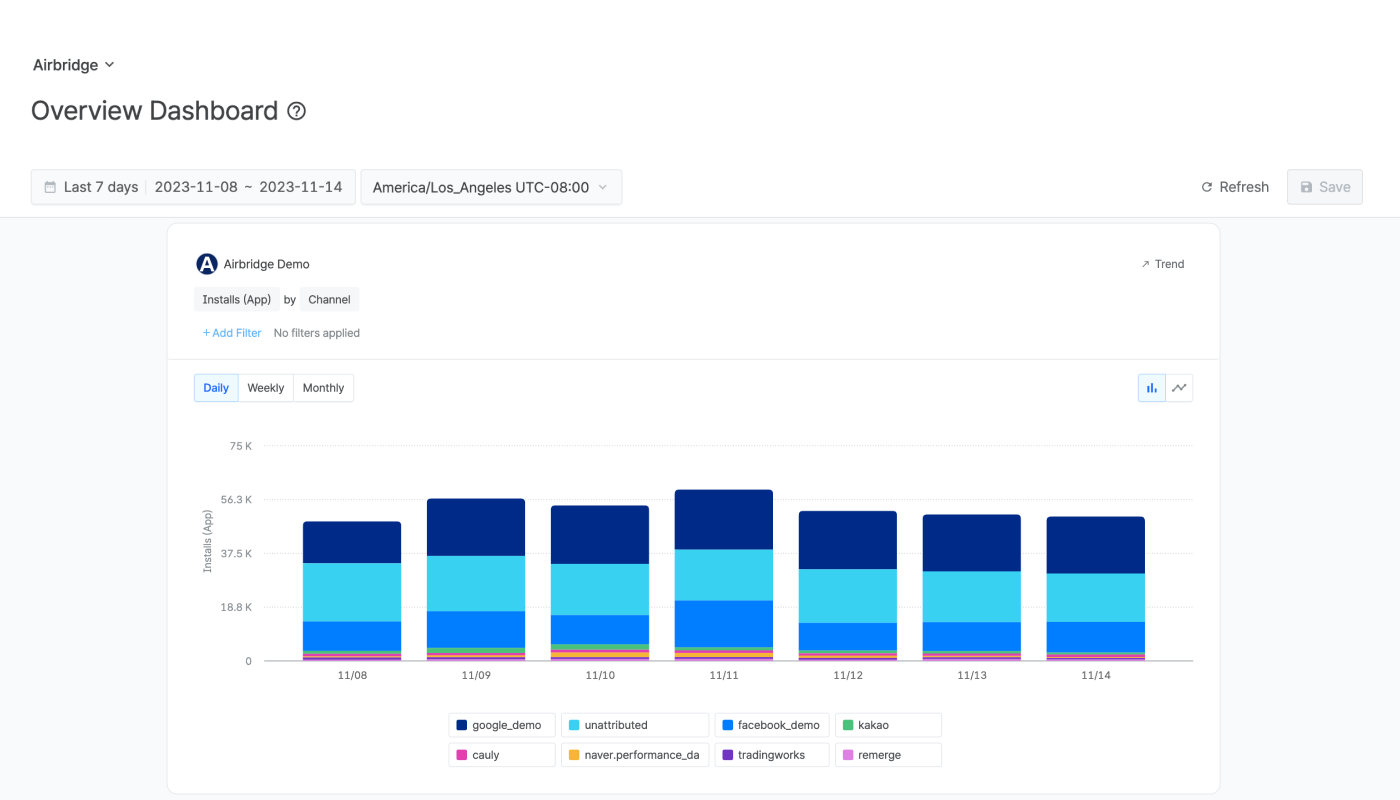
You can configure 4 charts in a horizontal bar or donut chart type.

You can configure multiple metrics, GroupBys, and filters in the table.
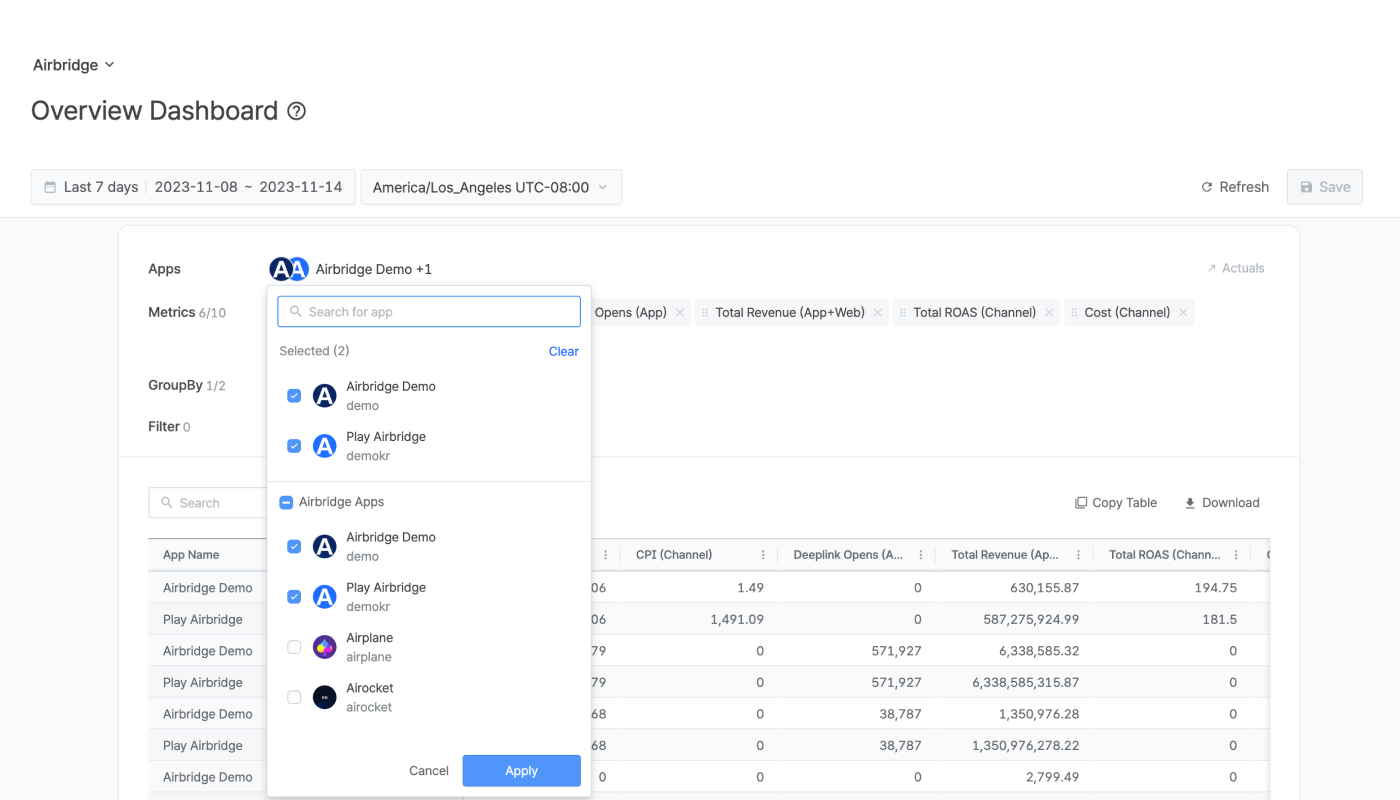
Select an app or multiple apps.
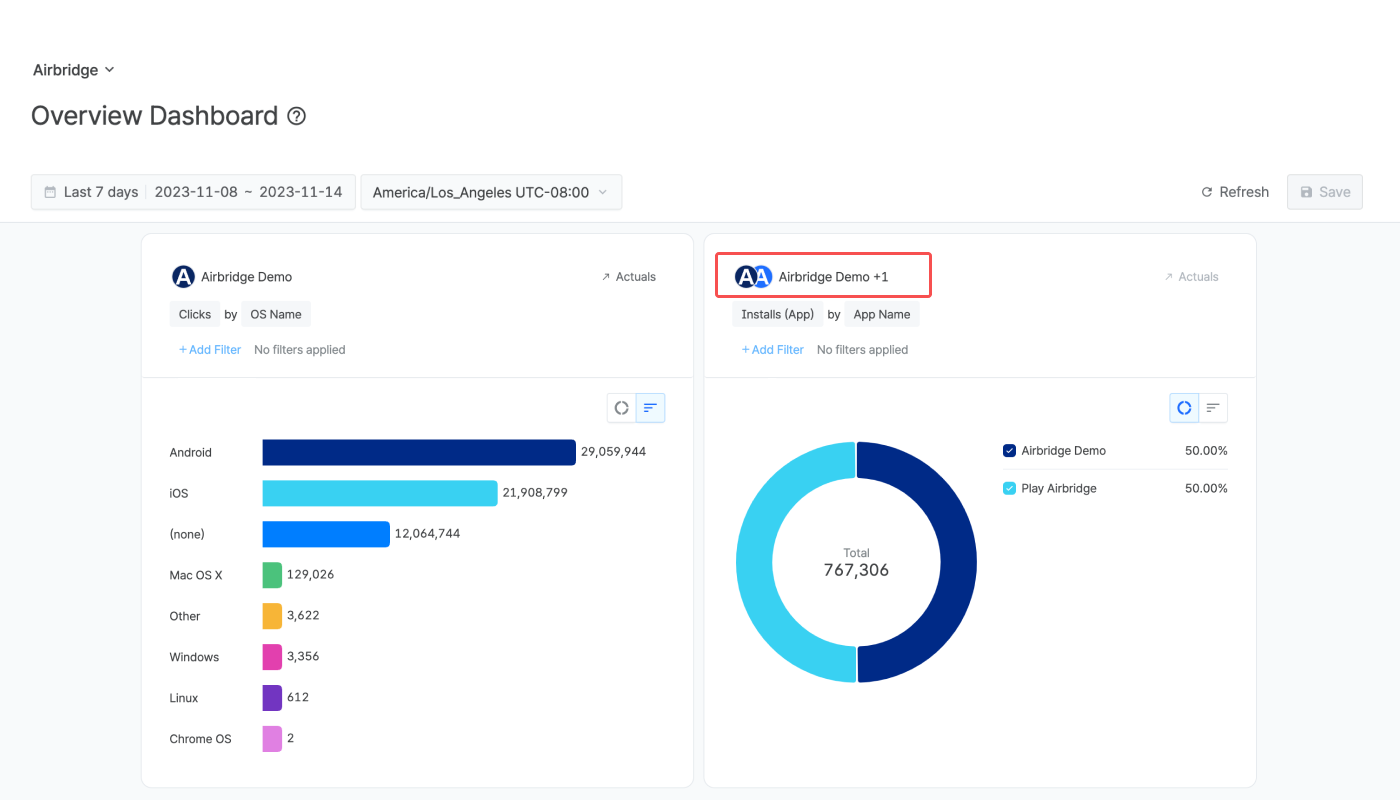
Configure the metric, GroupBy, and filter. Only 1 GroupBy can be selected for each chart. If you select multiple apps to visualize the metric data of multiple apps in one chart, the GroupBy will be automatically set to “App Name.”
Click the “Done” button.
Click on the chart icons to display the data in your preferred format: either a vertical bar chart, horizontal bar chart, donut chart, or line graph.
Note
You can select only 1 GroupBy for the charts in the Overview Dashboard. If you select multiple apps, the GroupBy will be automatically changed to “App Name,” and no other GroupBy can be applied.
If you want to get a more granular view of a metric, click Actuals or Trend on the chart or the table to see the data in the Actuals Report or the Trend Report. The Actuals Report and the Trend Report will open in a new tab with the same configuration set as in the chart or the table, where you can add more GroupBys and Filters.
If the numbers in the Overview Dashboard are different from the numbers in the Actuals Report, click Refresh in the Overview Dashboard.
Click Save to save your Overview dashboard. You can create multiple Overview dashboards. To create a new one, click the dropdown icon (⌄) next to the dashboard name, then click Create new.

Overview dashboards can be shared with your organization or set to Only me. Choose a sharing option when creating or duplicating a dashboard. To view dashboards by sharing setting, click the dropdown icon (⌄) next to the dashboard name.
Only me: Only you can access the dashboard
Shared: All users in your organization can access the dashboard
The following features are provided for saved Overview dashboards.
To duplicate an Overview dashboard, click the duplicate icon (+) next to the dashboard name. When duplicating, choose whether to share it with your organization or set it to Only me.
To share an Overview dashboard that’s set to Only me, click the more options icon (···) next to the dashboard name, then select Share with organization. Once shared, you cannot set it back to Only me.
To delete an Overview dashboard, click the more options icon (···) next to the dashboard name, then click Delete. Note that deleted dashboards cannot be restored.
Attention
Deleting a shared Overview dashboard immediately removes access for all users in your organization.
Customize your Overview Dashboard for daily monitoring with real-time data. You can easily track the ad performance of an app or compare the performance of multiple apps and get instant insights at a glance.
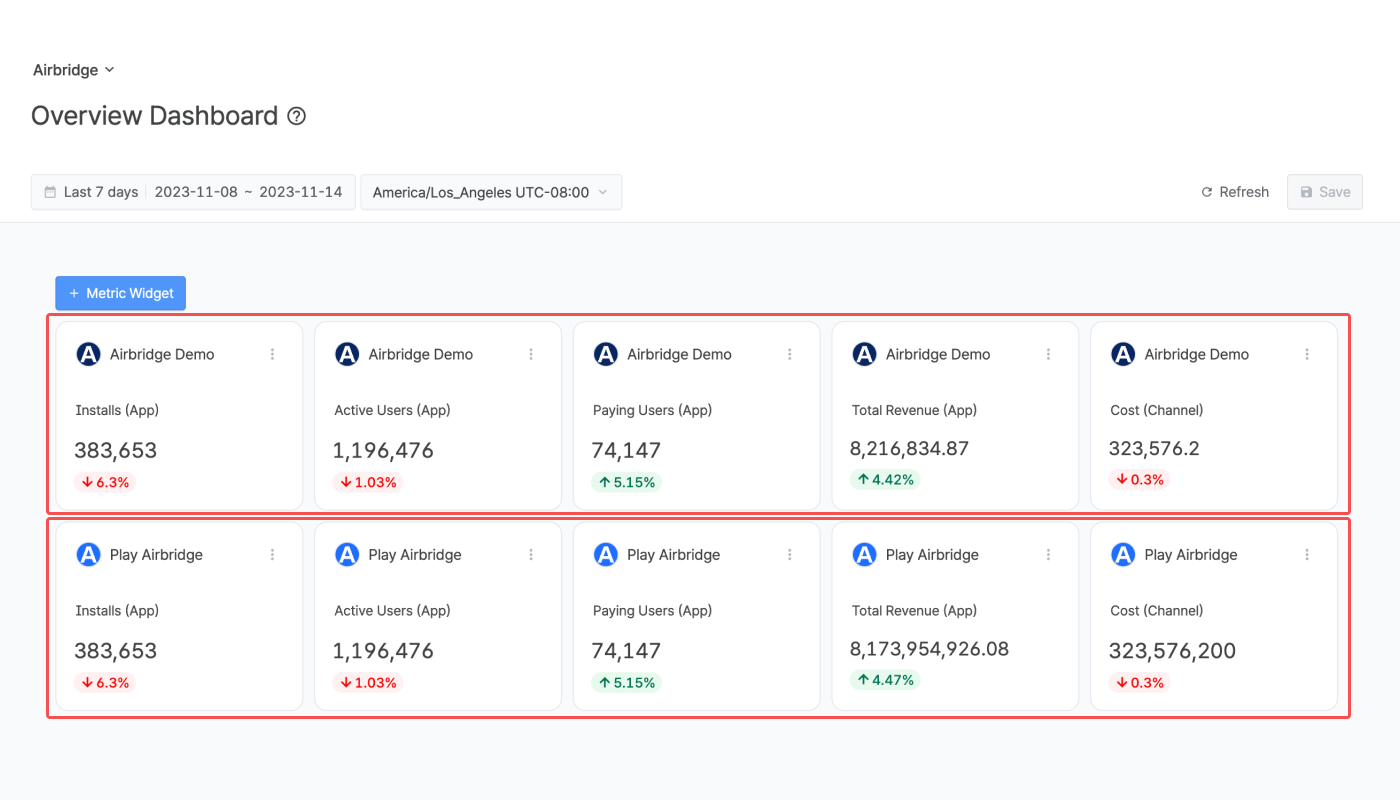
Using the metric widgets, you can easily monitor the key metrics of an app and the increase/decrease rate compared to the previous date range.

You can visualize the key metrics in various charts or in a simple table.
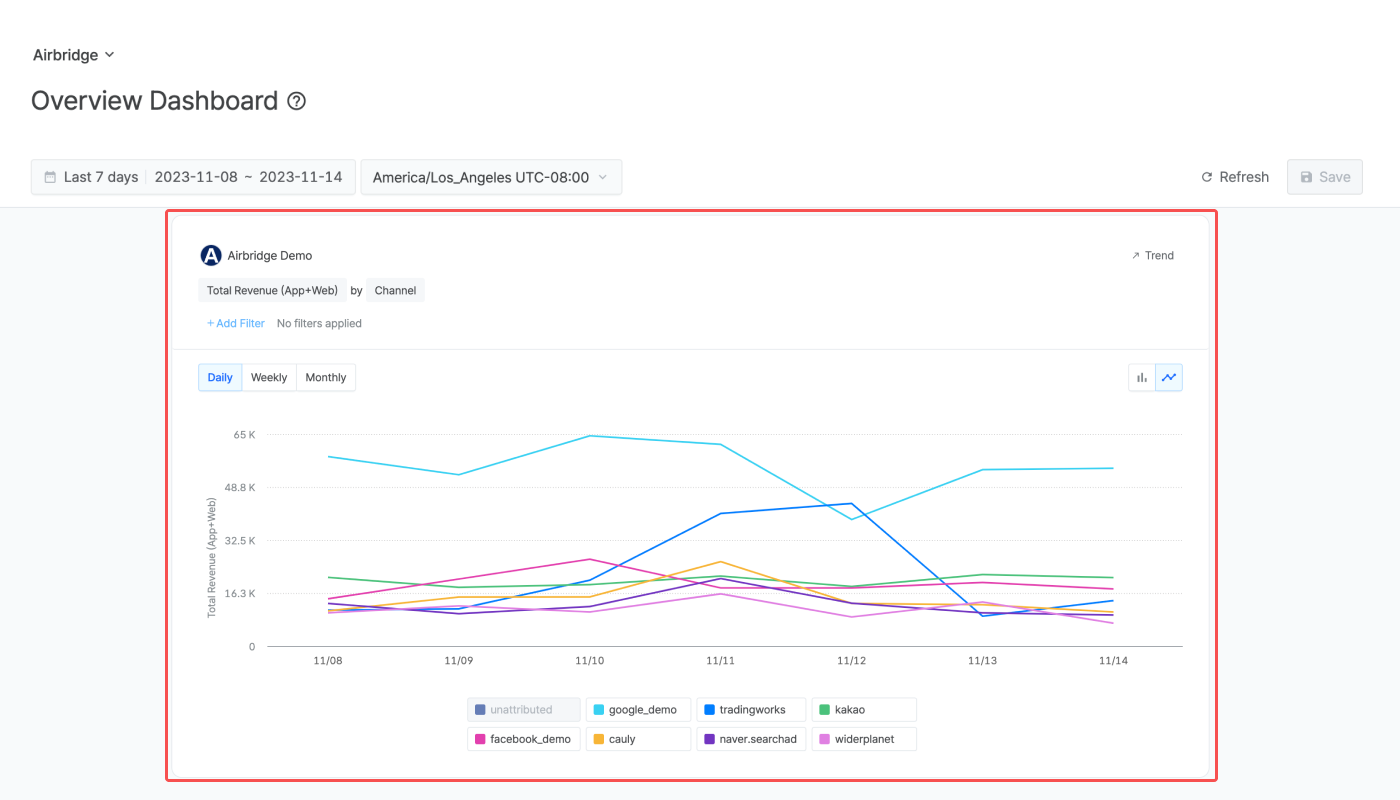
For more insights, you can see the data in the Actuals Report or in the Trend Report, which is opened in a separate tab with just a click.
Using the metric widgets, you can easily compare the key metrics of multiple apps and monitor the increase/decrease rate compared to the previous date range.
You can compare the key metrics of your apps in various charts or in a simple table.
Following Meta's privacy policy, Meta Ads campaign data is masked in Airbridge until you accept Meta's Advanced Mobile Measurement (AMM) Terms, provided that both of the following conditions are met for the set date range:
The sum of impressions and engaged views from Meta Ads campaigns is less than 1,000
The Meta Ads campaign data is imported to Airbridge through channel integration and cost integration
The masked data will be displayed as follows instead:
Display | Description |
|---|---|
Privacy Block | All data is masked; only "Privacy Block" will be displayed |
+α, ±α | Data is partially masked |
Note
To gain full visibility of your Meta ads campaign data in Airbridge reports, you need to accept Meta’s Advanced Mobile Measurement (AMM) Terms. Otherwise, Meta ads campaign data remains masked in Airbridge. For more information about Meta's AMM terms, refer to this article.
If Meta Ads data is still not visible after agreeing to the terms, you may try changing your report settings as follows:
Change or extend the date range. Only data from periods after consent is provided in raw data.
Change or remove some of the GroupBys and filters.
In the Overview Dashboard, all metrics, whether defined at the app level or the organization level, are available as listed below:
Defined at the app level: Metrics for custom events, Self-serve metrics
Defined at the organization level: Calculated metrics
Pay attention when using metrics defined at the app level and have varying definitions across apps within the organization.
Take a look at the scenarios below.
Let’s say there are two apps in your organization: App A and App B.
App A has configured a custom event named “subscription_renewal.”
App B has not configured a custom event named “subscription renewal.”
The following will happen when you select App A and App B in the Overview Dashboard and select “subscription renewal” as the metric.
For App A, the actual count of the custom event “subscription renewal” will be shown.
For App B, 0 will be shown for the custom event “subscription renewal”.
Let’s say there are two apps in your organization: App A and App B.
For App A, the self-serve metric named “app_push_notification” tracks the number of app push notifications sent.
For App B, the self-serve metric named “app_push_notification” tracks the click rate for app push notifications.
The following will happen when you select App A and App B in the Overview Dashboard and select “app_push_notification” as the metric.
For App A, the number of app push notifications sent will be shown.
For App B, the click rate for app push notifications will be shown.
Note how the data shown are different, even though the metric name is the same as “app_push_notification” for both App A and App B.
Note
It is advised to use the same definition for events or metrics with the same name across all Apps in your organization. Using consistent names and definitions within the organization can enhance efficiency in analyzing ad performance reports across multiple Apps.
Calculated metrics are defined at the organization level. However, pay attention if the formula defining the calculated metric includes a metric specific to an Airbridge App.
Take a look at the scenario below.
Let's say App A and App B are registered with your organization. As illustrated in the table below, custom events and self-serve metrics are created to measure App A and App B.
|
push_sent |
in_app_sent |
push_clicked |
|---|---|---|---|
Description | Custom event for tracking the number of push notifications sent | Custom event for tracking the number of in-app messages sent | Self-serve metric for tracking the number of push notification clicks |
App A | Defined | Defined | Defined |
App B | Defined | Defined | Not Defined |
Let's say the following 2 calculated metrics were also created, with the formulas including the custom events and self-serve metrics described in the table above. A calculated metric created for 1 App can be used for all Apps registered with the organization.
message_sent = push_sent + in_app_sent
push_click_rat
e= push_clicked / push_sent * 100
The calculated metrics will work differently for App A and App B as illustrated in the table below.
|
message_sent |
push_click_rate |
|---|---|---|
App A | The calculated metric data is displayed. | The calculated metric data is displayed. |
App B | The calculated metric data is displayed. | The calculated metric shows 0 because the “push_clicked” self-serve metric has not been defined for App B. |
If you open an Airbridge report from the Overview Dashboard and it contains a metric that is not intended for the specific app, that metric will be excluded from the Airbridge report, while the other configuration settings will still be copied from the Overview Dashboard.
Let’s say there are two apps in your organization: App A and App B. App A has configured custom events named “subscription_renewal” and “refund.” App B has not configured custom events named “subscription_renewal” and “refund.”
Overview Dashboard Configuration |
Description |
|---|---|
Both configured metrics and not configured metrics selected | 1. Select App B in a chart in the Overview Dashboard. 2. Select “subscription_renewal” and “Installs (App)” as metrics. Add GroupBys and filters as necessary. 3. Click Actuals to open the Actuals Report with the same configuration. 4. The Actuals Report opens, but the metric “subscription_renewal” is excluded. Therefore, the Actuals Report shows data for the “Installs (App)” metric, with the same GroupBy and filter configuration. |
Only not configured metrics selected | 1. Select App B in a chart in the Overview Dashboard. 2. Select “subscription_renewal” and “refund” as metrics. Add GroupBys and filters as necessary. 3. Click Actuals to open the Actuals Report with the same configuration. 4. The Actuals Report opens, but the metrics “subscription_renewal” and “refund” are excluded. Because no metrics are selected, there is no data to show, and the Actuals Report configuration is reset. |
The Overview Dashboard displays data in each app currency setting. When you have multiple currency settings across your apps and you put the data of your apps together in a single chart or table, you will see a mix of currencies in the dashboard.
このページは役に立ちましたか?