Creating a Funnel Report
To access your Funnel Report, log in to your Airbridge account and navigate to [Reports]>[Funnel] in the left sidebar.
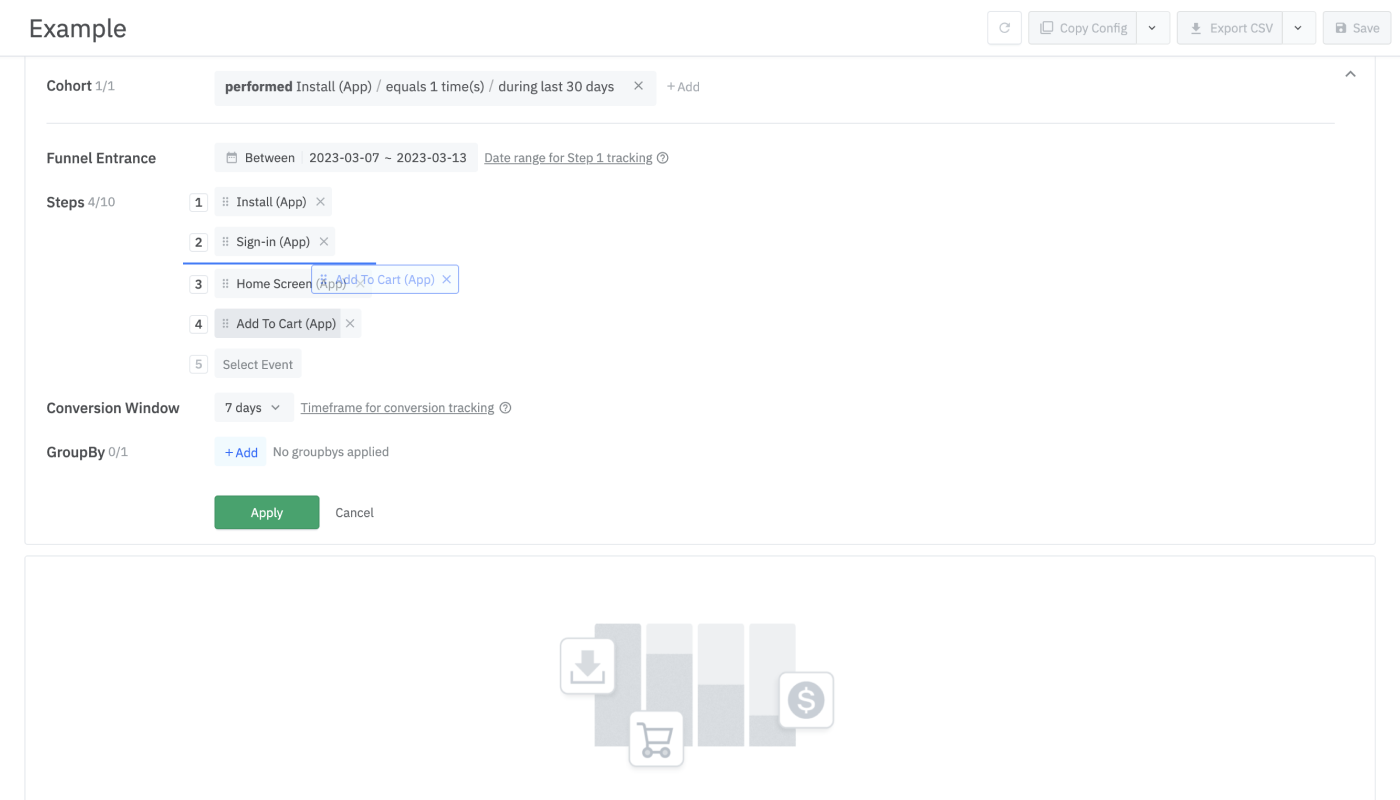
Create a Funnel Report by specifying a cohort and defining your funnel steps. Create your funnel with the steps that align with the user journey you want to analyze.
The following settings are required to view the Funnel Report. The Funnel Report tracks users who enter the funnel and convert through the funnel until the final step.
Settings | Description | Is it required? |
|---|---|---|
Identifier | The basis for determining unique users. The attribution results may differ depending on which identifier is selected. | Yes |
Cohort | A defined user group you want to analyze in the report. If not specified, all user data will be used for the funnel analysis. | No |
Funnel Entrance | The date range for users to enter the funnel. Users who have not completed Step 1 during this timeframe will not be tracked further through the funnel. | Yes |
Steps | Events you choose to analyze in the report. Add event property filters to further specify the steps. | Yes |
Conversion Window | The timeframe for tracking the behavior of users who have entered the funnel. Only the Steps that have been completed within this timeframe will be tracked. | Yes |
GroupBy | Options to set how to view the user data in the report. | No |
Select between “Device” and “User” and decide which identifier to use to determine unique users in your Funnel Report.
For more information about the identifiers supported in Airbridge, refer to this article.
Airbridge Device IDs are used to determine unique users.
Airbridge IDs are used to determine unique users. Selecting "User" is recommended if you want to set both web and app events as steps.
Best practices for identifier selection
When selecting the identifier, consider the nature of the user journey you want to reconstruct.
If the user journey consists of only app events or web events, select the identifier you see fit.
If the user journey includes both app and web events, it is advised to select "User.”
Configuring a cohort in the Funnel Report allows you to analyze the user behavior of a specific user segment. The cohort configuration is optional. Click Add to configure a cohort.
Read on to learn how to set up a cohort by configuring condition clauses.
Operator |
Description |
Option |
|---|---|---|
performed event | - Users who performed an event | App events |
didn't perform event | - Users who didn’t perform an event | App events |
where (had property) | - Non-event-related property of the users - Multiple properties can be added with “and” by clicking “+had property” | Property and value |
- Number of events performed by users | - Number of events performed by users | - equals - more than or equals - more than - less than or equals - less than |
when | - Time period the users performed the event - Can be set to max. 90 days - When using “between,” you can select from 2023-02-01 onwards - When using “during last,” you can decide whether to include “Today” or not | - during last - between - since |
You can use the following operators to add multiple condition clauses for a cohort.
Operator | Description |
|---|---|
or | Users who meet the aforementioned condition clause or the condition clause that follows |
and also | Users who meet the aforementioned condition clause and also meet the condition clause that follows |
and not also | Users who meet the aforementioned conditions but do not meet the condition that follows |
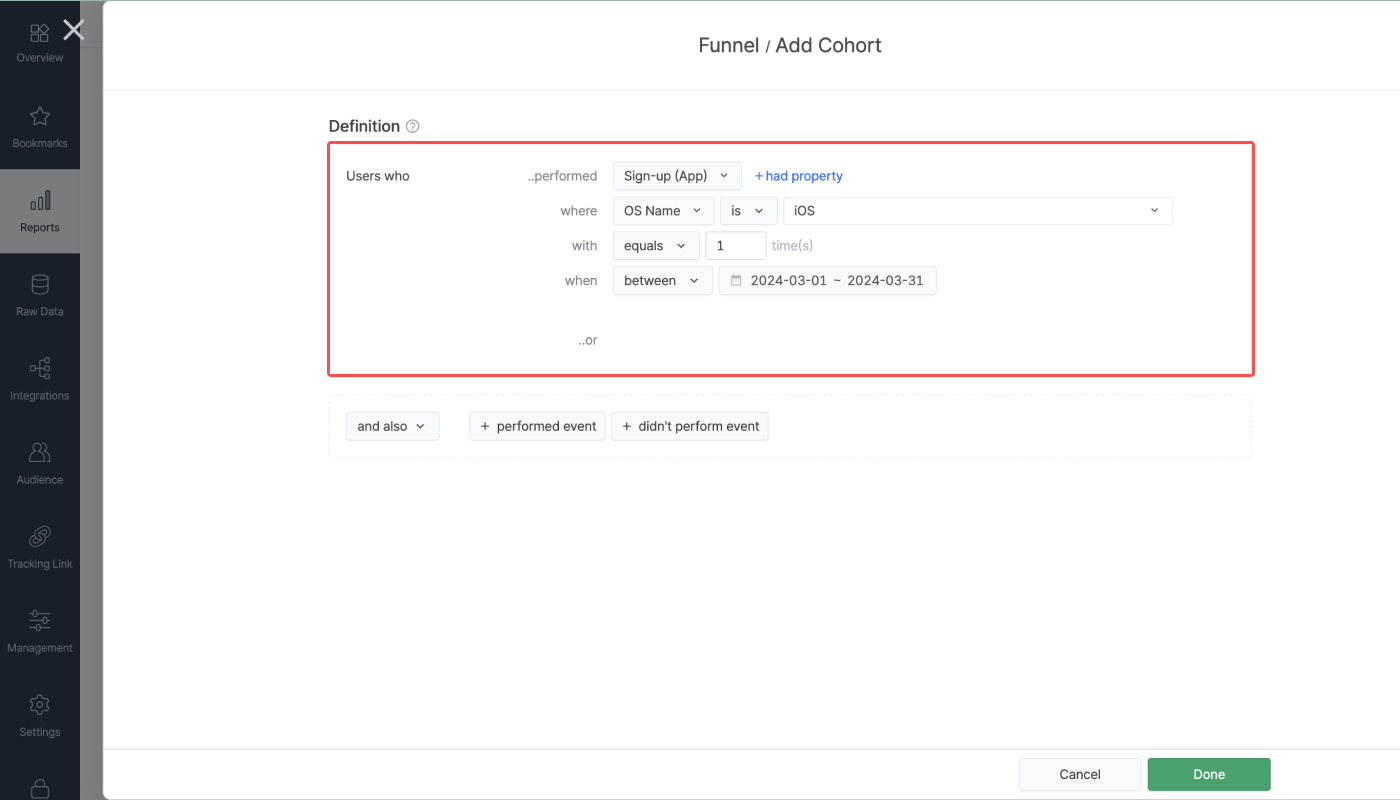
Let’s say you want to define a cohort as a group of iOS users who signed up for your service in March 2024. In that case, you may configure the cohort like in the image below.
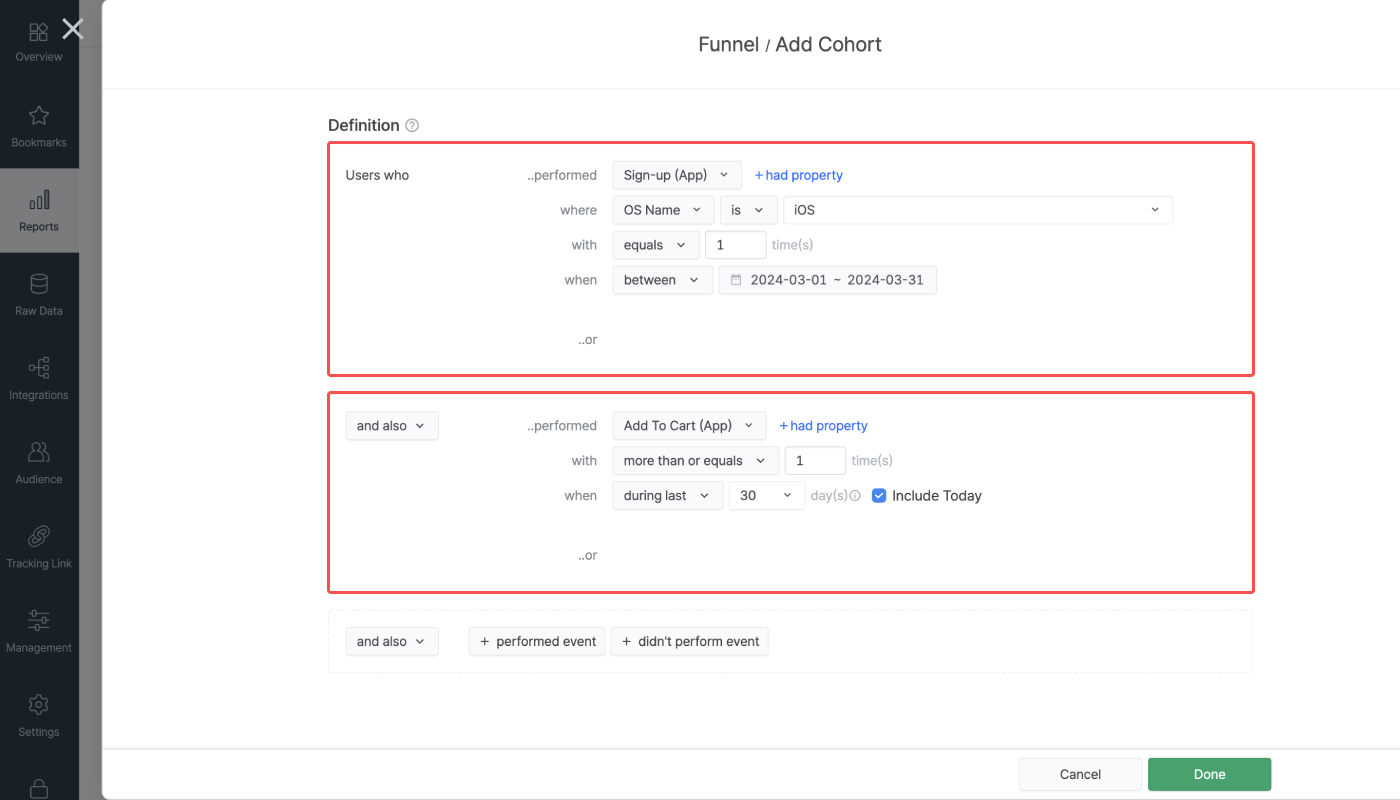
Let’s say you want to define a cohort as a group of iOS users who signed up for your service in March 2024 and also added an item to the cart at least once during the last 30 days, including today. In that case, you may configure the cohort like in the image below.
The steps are the events you want to analyze in your Funnel Report. You can select any Airbridge Event as a step. You must set at least 2 steps to create a report; the maximum number of steps you can set is 40.
Click the [filter] icon next to the event you selected as a step to add event property filters. By adding event property filters, you can further specify the step based on the properties collected along with the event.
Up to 3 event property filters can be added. When multiple properties are added, events that meet all filters define the step. The event property filters are optional.
Refer to the following examples.
Let’s say the steps in the Funnel Report have been configured, as shown in the following table.
Event | Event Property | |
|---|---|---|
Step 1 | Install (App) | Not configured |
Step 2 | Achieved Level (App) | Event Action is Level 2 |
Step 3 | Achieved Level (App) | Event Action is Level 3 |
Step 2 and Step 3 are both set to Level Achieved (App) but with different event properties. The conversion rate from Step 1 to Step 2 is the proportion of users who have completed Level 1 and converted to playing Level 2 from the total users who installed the app. The conversion rate from Step 2 to Step 3 is the proportion of users who have converted to playing Level 3 from the total users who completed Level 2.
Select Channel as a GroupBy to view the conversion rate and time to convert by ad channels. By monitoring this Funnel Report, you can understand which ad channel brings in users that drop-off at early stages of the game or quickly progresses through the game after install.
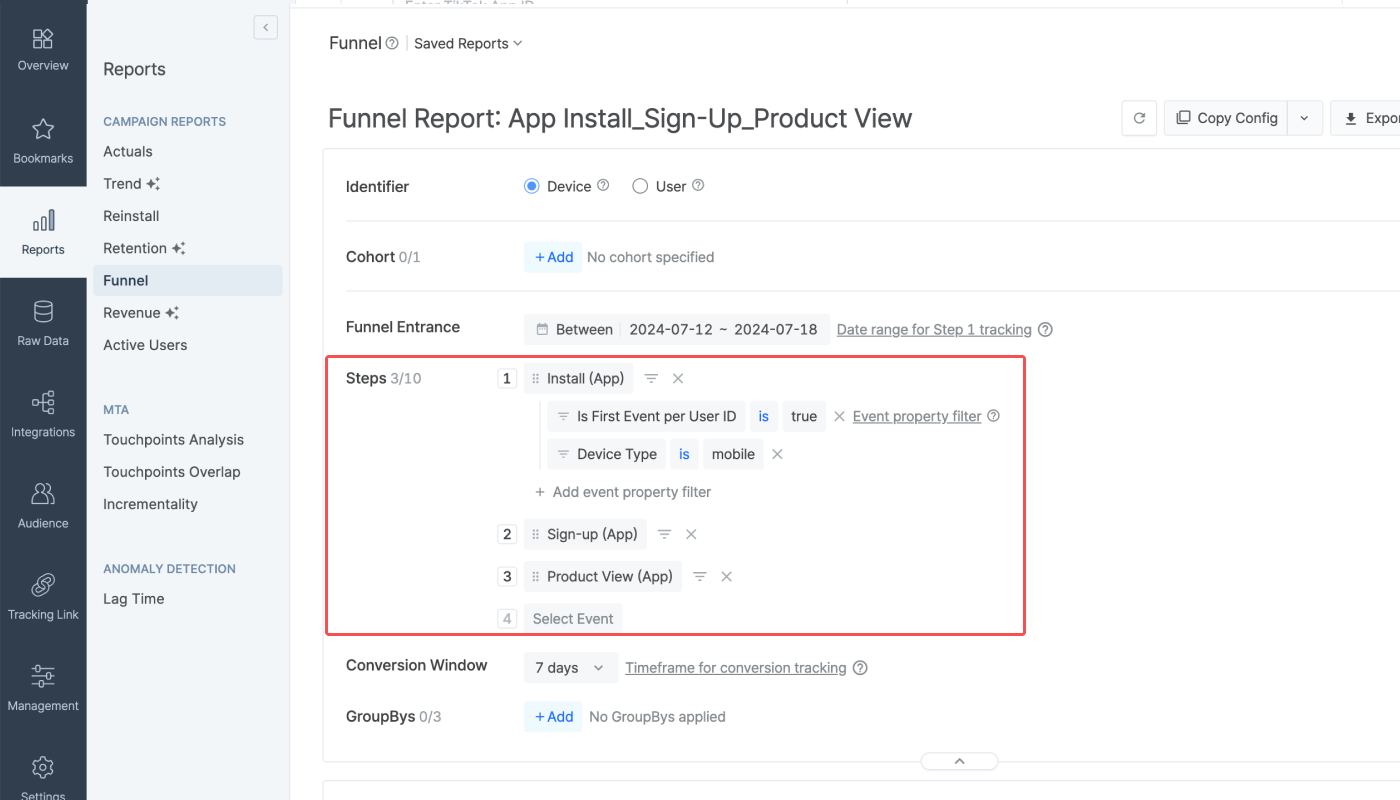
Let’s say the steps in the Funnel Report have been configured as shown in the following table.
Event | Event Protperty | |
|---|---|---|
Step 1 | Install (App) | Is First Device ID is true |
Step 2 | Sign-up (App) | Not configured |
Step 3 | Order Complete (App) | Event Label is mens_pants |
Step 1 is set to Installs (App) with the event property "Is First Event per Device ID" is true . This means that users who performed Installs (App), which is determined to be the first event based on the device ID, will enter the funnel.
Step 3 is set to Order Complete (App) with the event property "Event Label is mens_pants". This means that from the users who converted through Step 2, users who have ordered pants for men will convert through Step 3.
Select "Channel" as a GroupBy to view the conversion rate and time to convert by ad creatives. By monitoring this Funnel Report, you can understand which ad creatives were effective in driving the purchase of new users or how quickly new users exposed to specific ad creatives progress from app install to purchases.
The Funnel Report shows you how many users converted from one step to the next. The analysis result is not influenced by any events outside the funnel that users may have performed in between the funnel steps. However, the order of the steps influences the analysis results.
Click “Select Event” to set the funnel steps. You can change the order of the steps by dragging the steps. Click the [x] icon to delete the steps.
For example, if you change the order of Steps A, B, and C, the analysis result will change even for the same cohort.
Step | A | B | C |
|---|---|---|---|
Number of Users | 100 | 50 | 10 |
Step | A | C | B |
|---|---|---|---|
Number of Users | 100 | 17 | 0 |
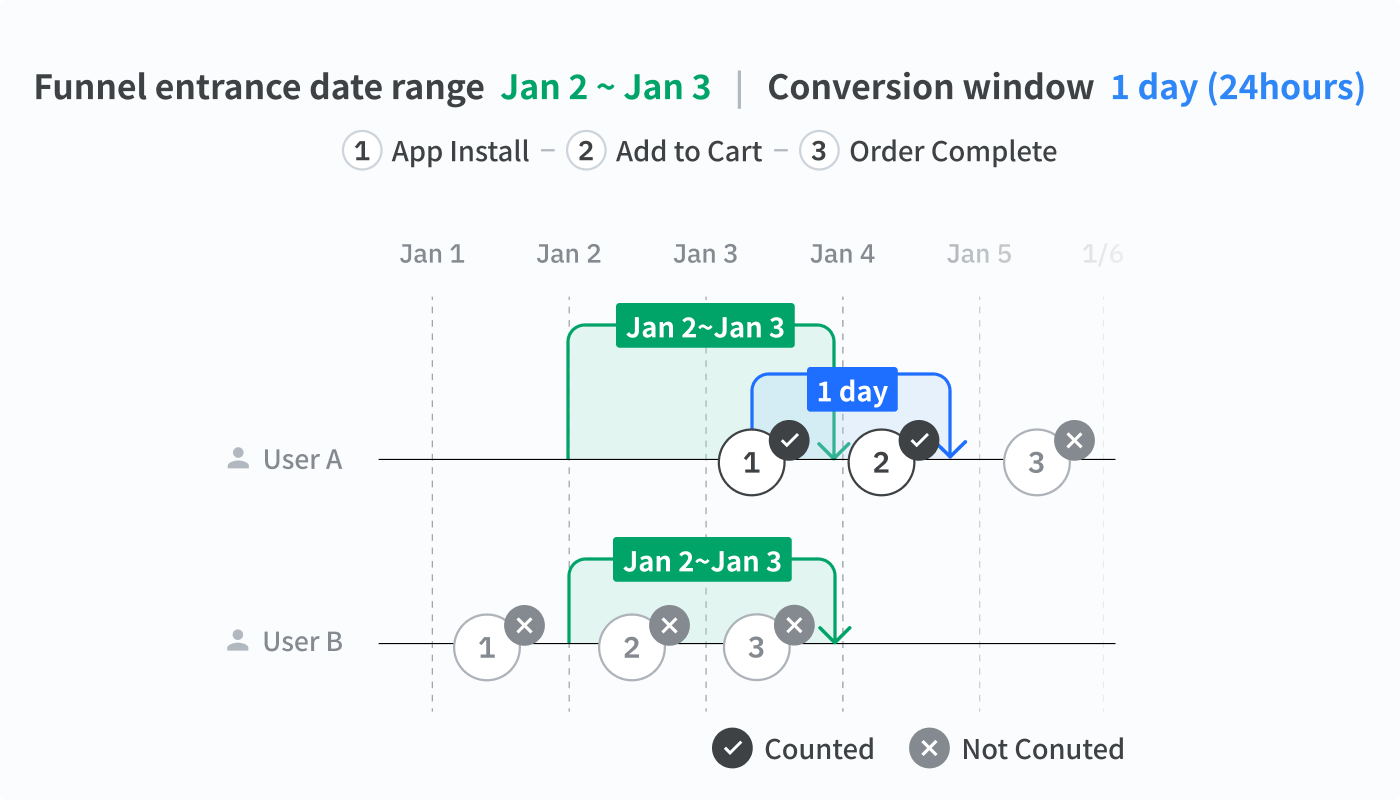
The funnel entrance date range is the date range for users to enter the funnel. Only users who complete the first step within the set timeframe enter the funnel and are further tracked. The conversion window is the timeframe for tracking the behavior of users who enter the funnel. Events performed outside the conversion window are not tracked.
Funnel entrance date range: From Jan 2 to Jan 4
Conversion window: 1 day (24 hours)
Only users who completed Step 1 between Jan 2 to Jan 4 enter the funnel and are further tracked for the next 1 day (24 hours). If a user completed Step 1 at 3:00 PM on Jan 2, this user's behavior will be tracked until 3:00 PM on Jan 3. Any events performed after 3:00 PM on Jan 3, will not be tracked.
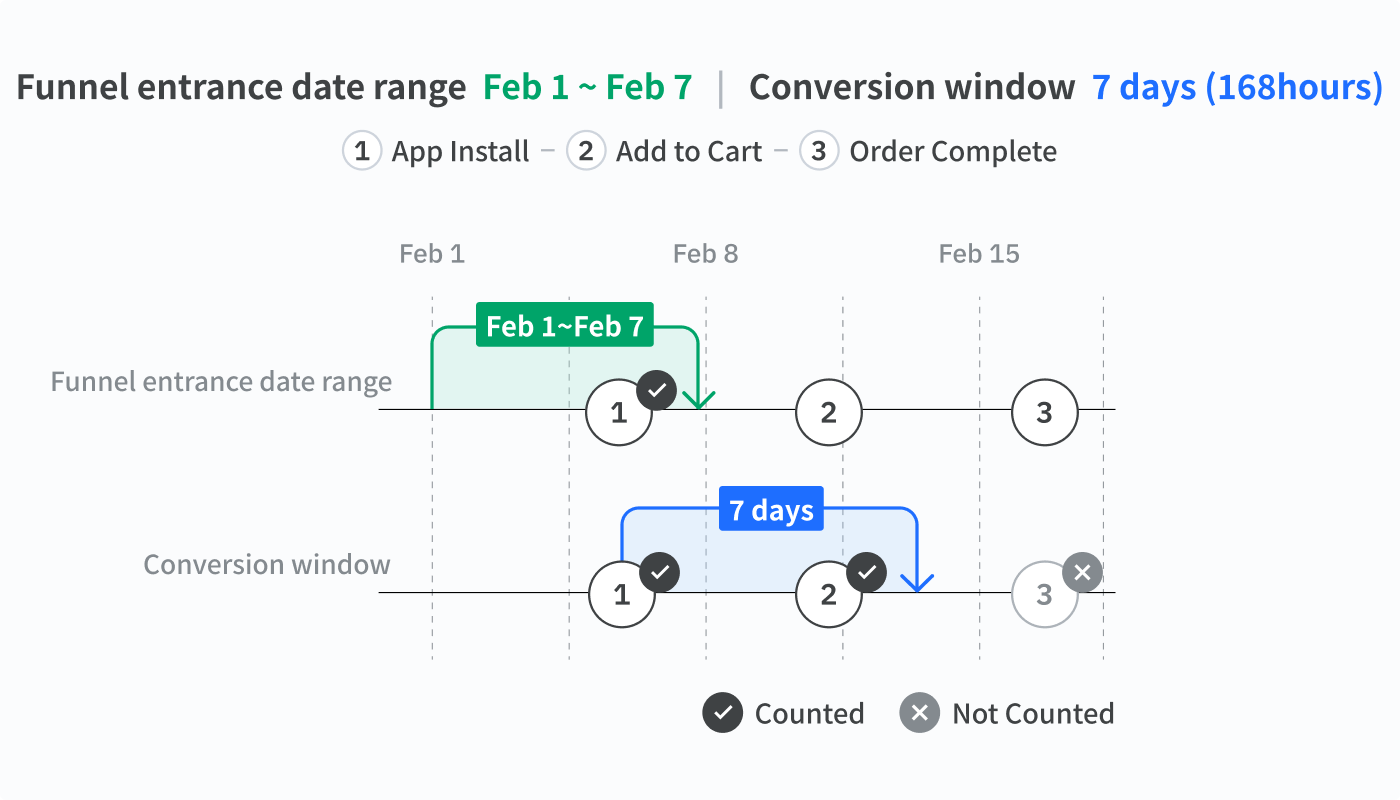
Funnel entrance date range: From Feb 1 to Feb 8
Conversion window: 7 days
The funnel entrance date range is the date range for tracking the Step 1 event only, and the conversion window is the timeframe for tracking the following steps. In this example, users who completed Step 1 between Feb 2 and Feb 8 enter the funnel. The conversion window is set to 7 days, meaning if a user completes Step 1 on Feb 8 at 9:00 PM, this user’s behavior will be tracked until Feb 15 at 9:00 PM.
Use the date operator to set the funnel entrance date range, which is limited to the data retention period. You can select up to 175 days.
Date Operator | Options | Date Range |
|---|---|---|
Between | Start date, end date | From start date to end date |
Since | Start date | From start date to today |
Last | Number (N) | From the past N days until the day before today |
When selecting “Last”, you can check the “Include Today” checkbox to include the current date in the analysis period. When you click “+ Offset” and enter a number, there will be a buffer of N days between the last day of the analysis period and the current date.
For the conversion window, you can either choose from 1, 7, 30, 60, 90, and 175 days or type in any number between 1 and 175. For example, if you choose 7 days, the conversion window of the Funnel Report will be 7 days.
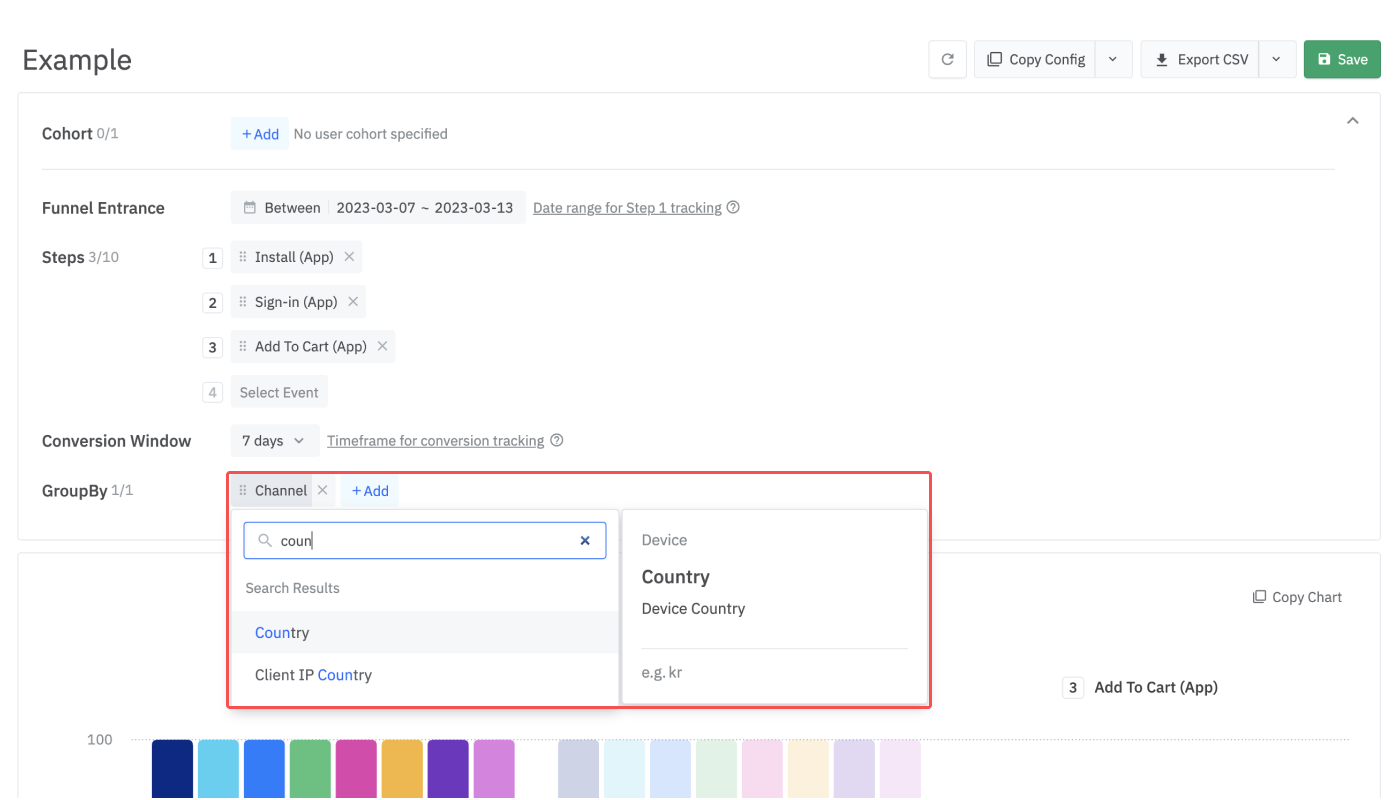
GroupBy options are used to group users. GroupBys are applied to your user cohort. Using GroupBys, you can compare different groups within the same cohort at a glance.
For example, if you select “Country” as a GroupBy, your users will be grouped by countries. Understanding at which step users of different countries tend to drop off will help you adjust your global marketing strategies.
Click Add next to [GroupBy] to select a GroupBy in the configuration box. Up to 3 GroupBys can be selected. GroupBys are optional.
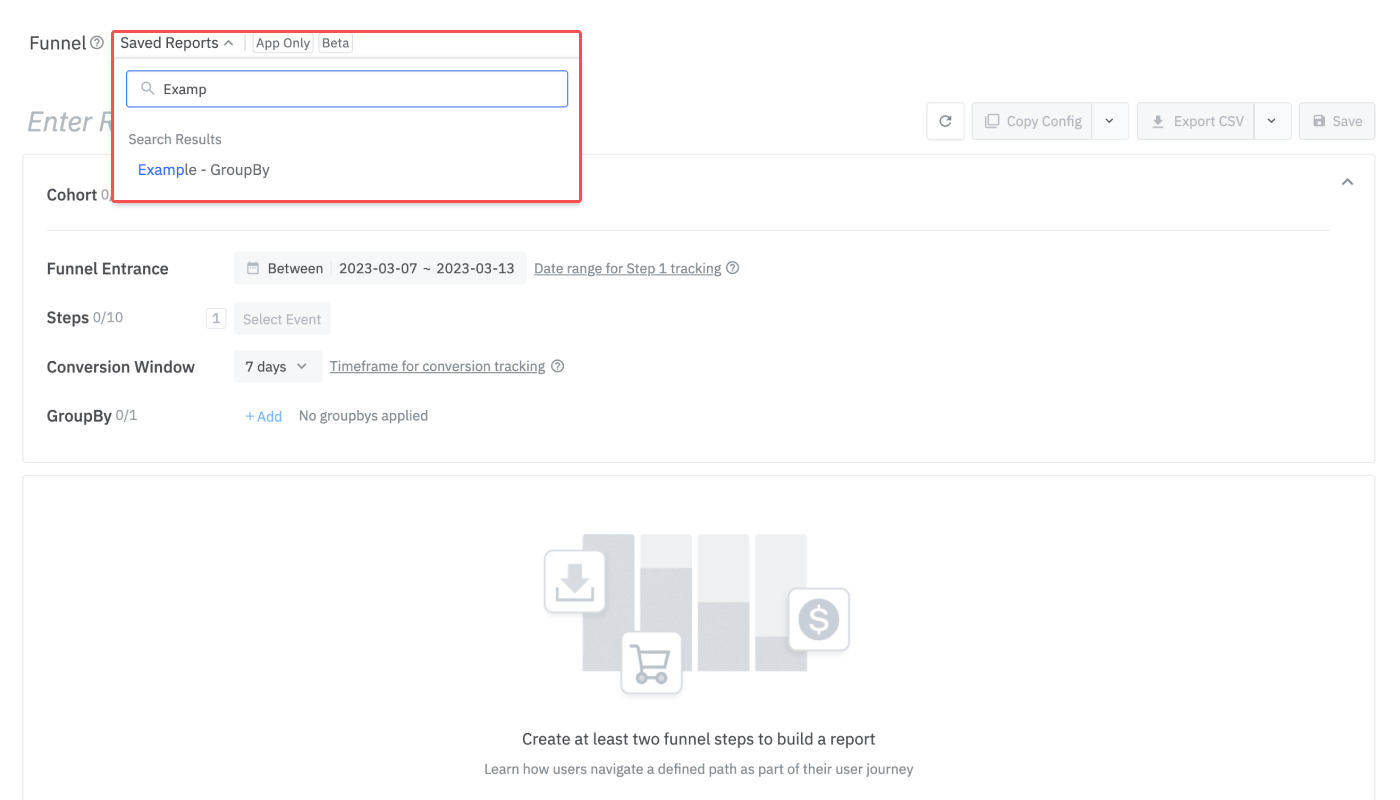
The Funnel Report provides the analysis result in charts and tables. You can download the results as a CSV file. You can also save your funnel report settings to revisit the same report whenever needed.
The below table shows what you can see from the chat and table in the Funnel Report.
Chart | Table |
|---|---|
- Total Conversion (No. of Users) | - Total Conversion (No. of Users) |
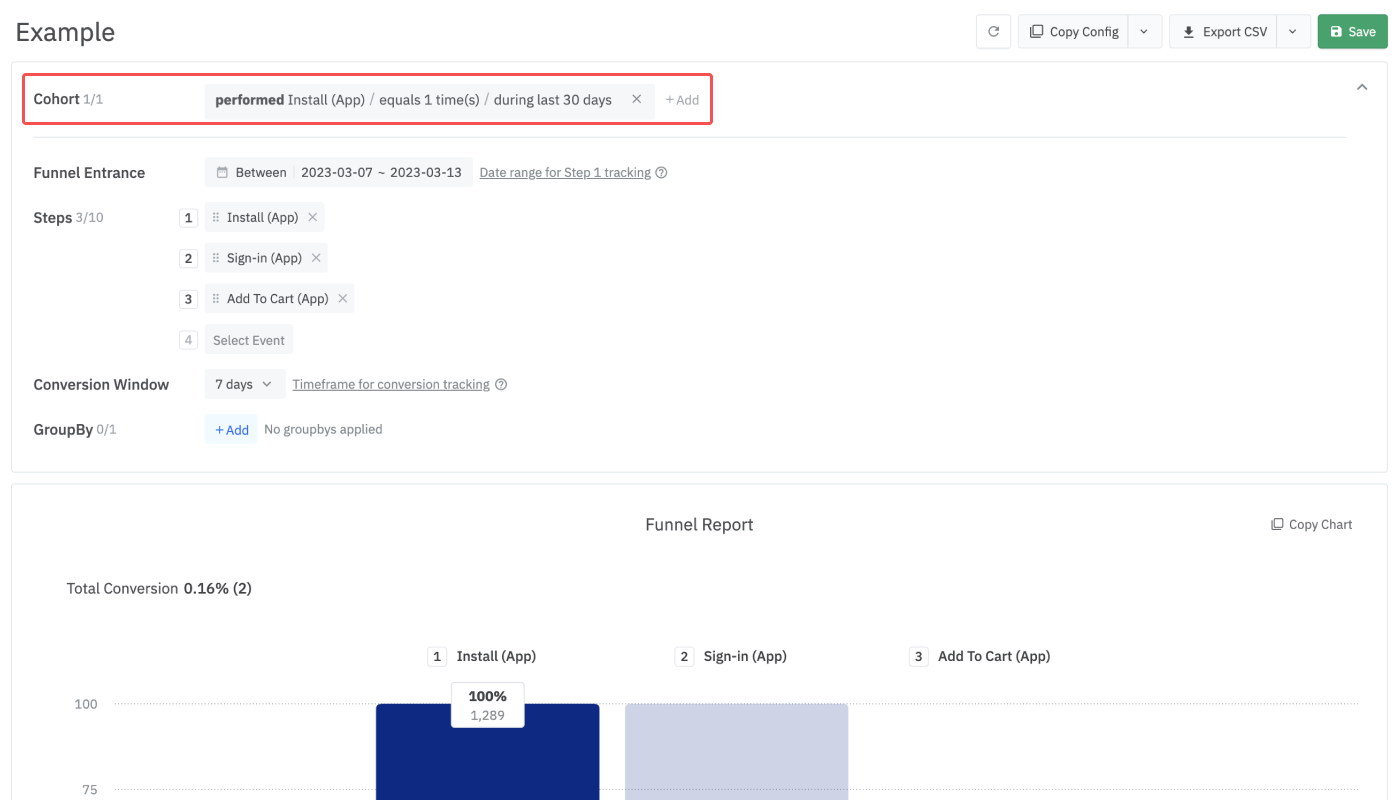
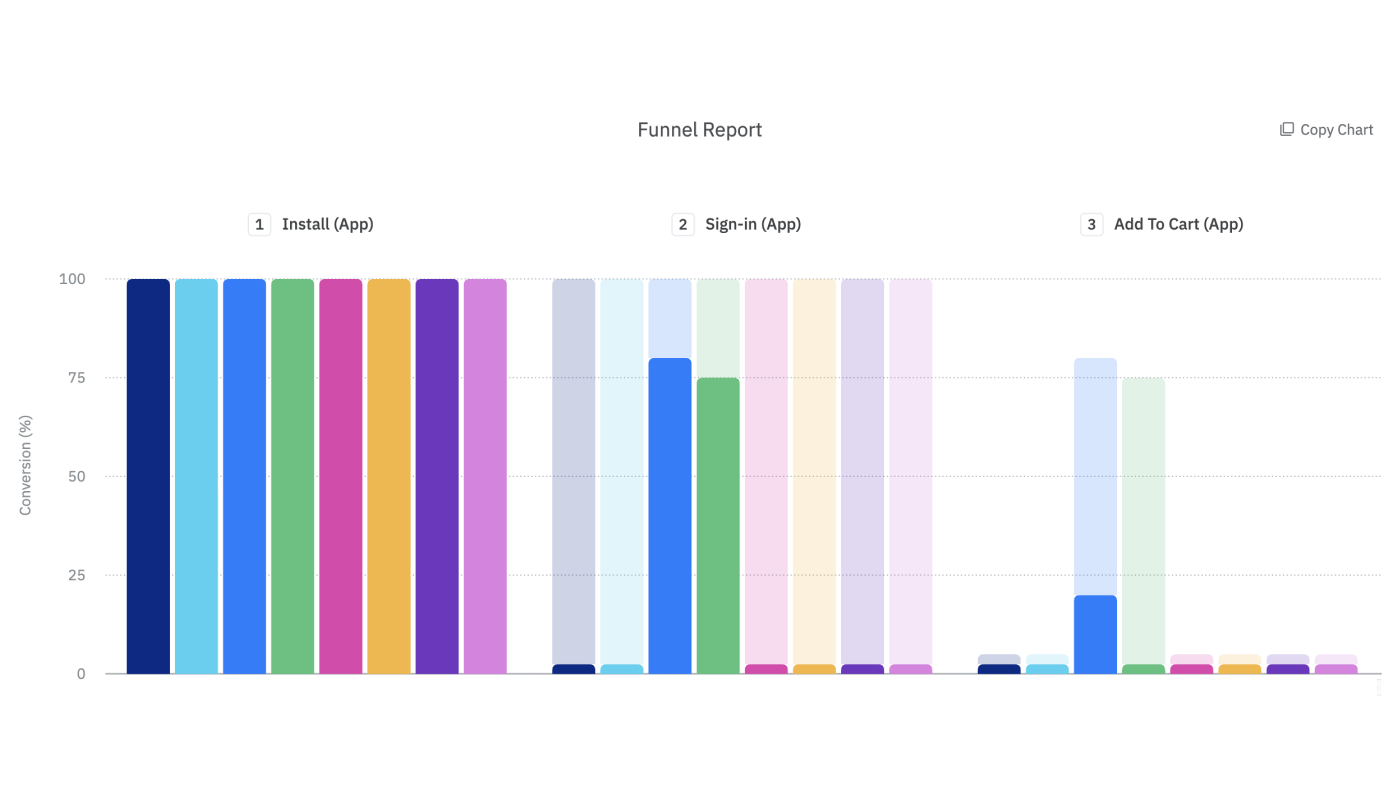
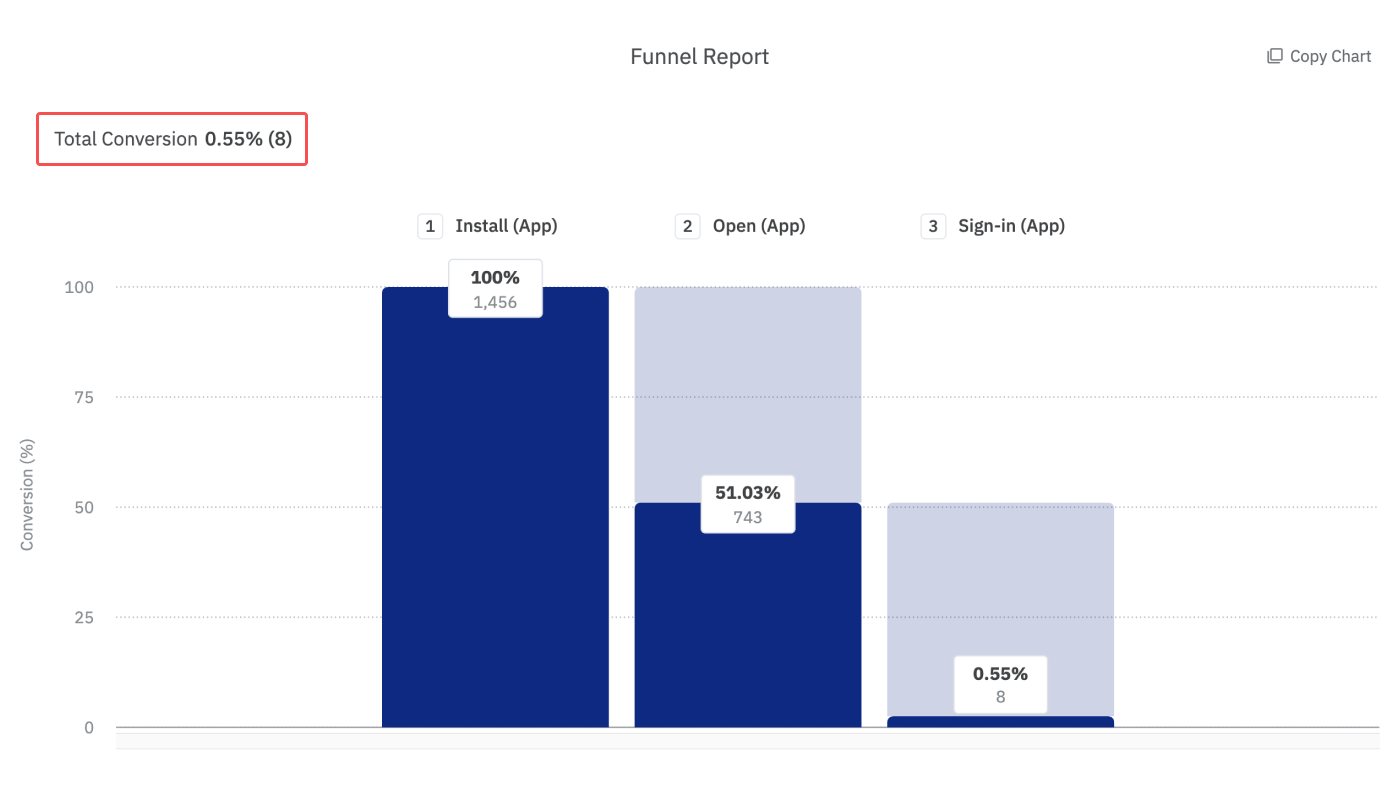
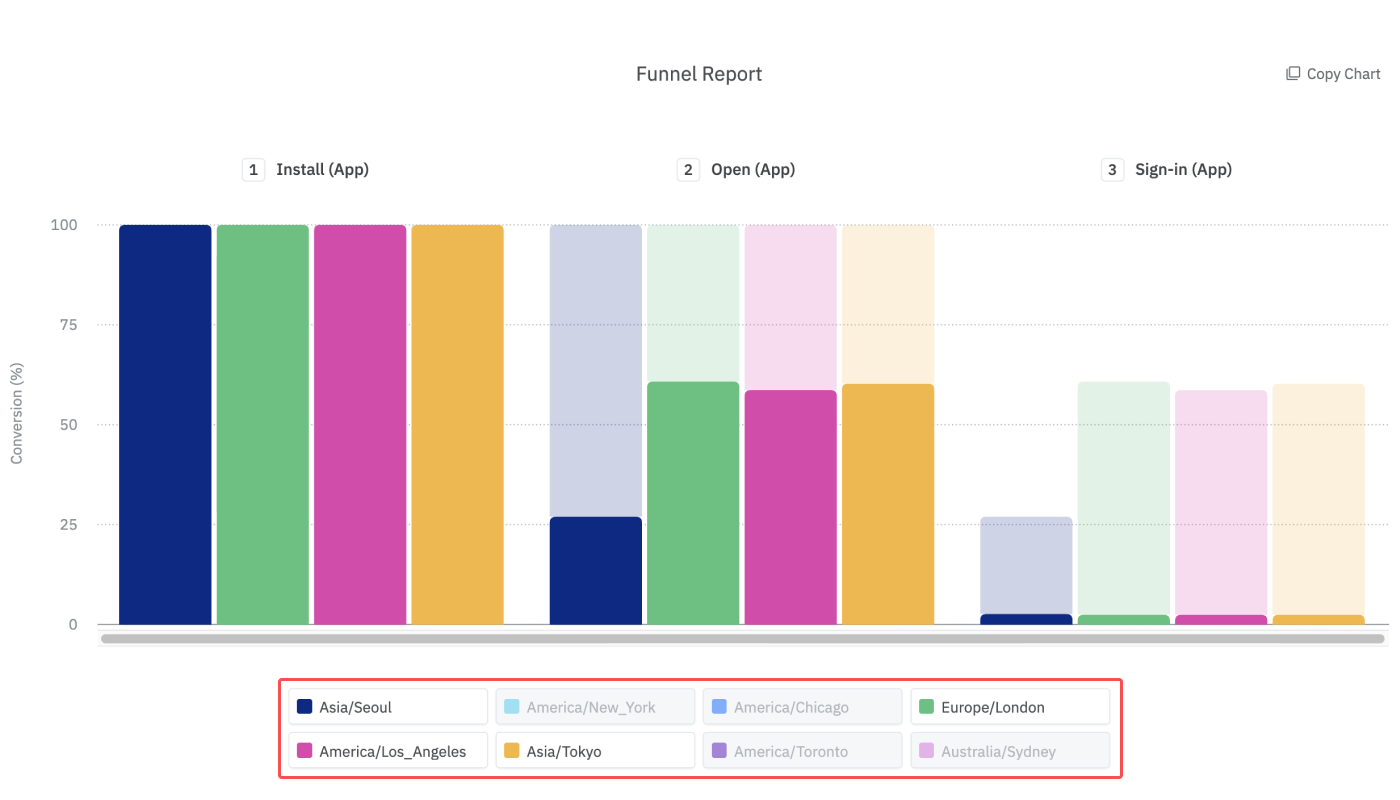
The bar chart in the Funnel Report shows the different conversion rates for each step at a glance.
The numbers you can see at the top of the bars are the total conversion rate and the number of users who completed each step. The final conversion rate and the number of users who converted through the funnel can be found in the upper left corner of the chart.
When you look at the below example, the number above the second bar, “51.03%”, means that the percentage of users who completed the second step was 51.03% of those who completed Step 1. The number “743” means that 743 users completed Step 2. In the upper left corner of the chart, you can see that the final conversion rate is 0.55% and that 8 users converted through the funnel from the first to the last step.
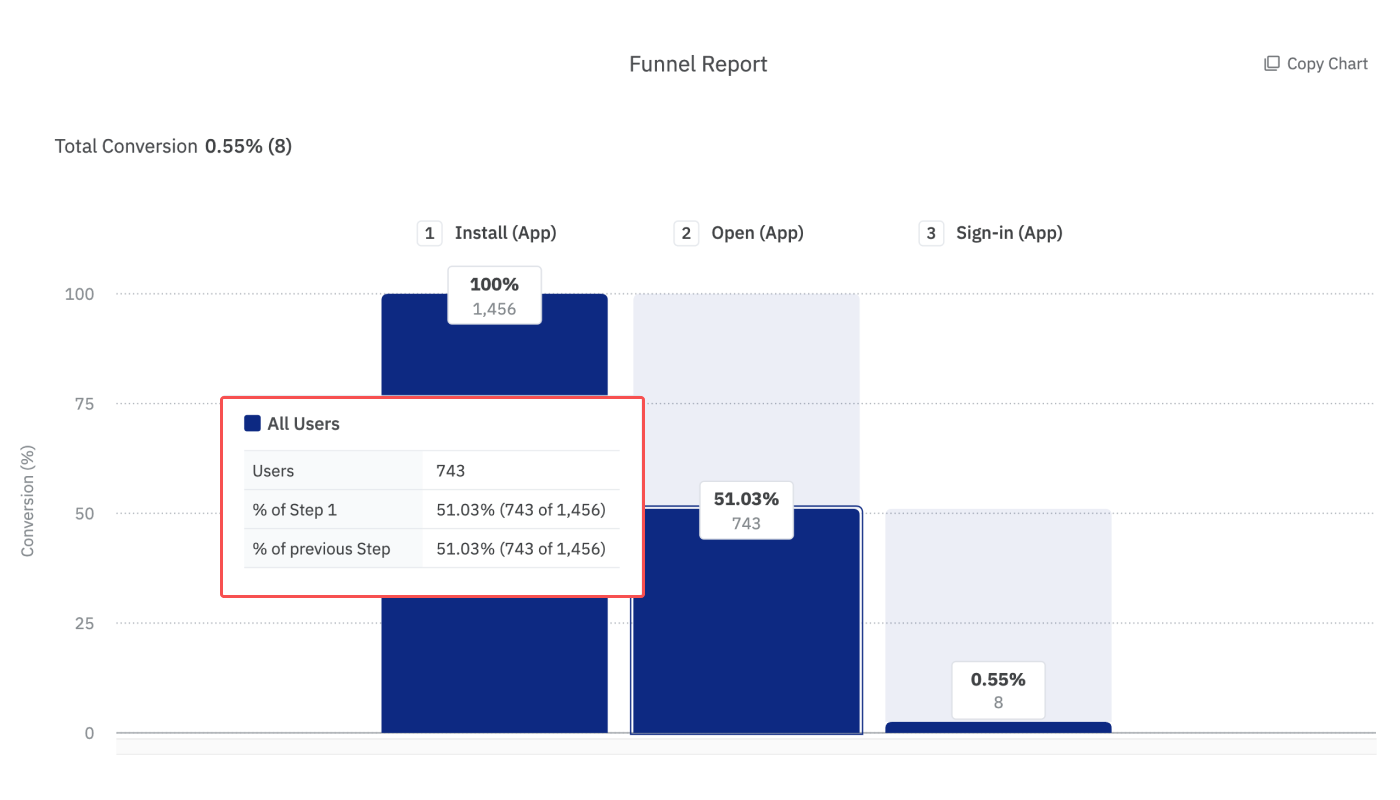
By hovering your mouse pointer over each bar, you can see a box with the number of converted users, the percentage of users converted from Step 1, and the percentage of users converted from the previous step. When you hover your mouse pointer over the grey part of each bar, you can view the percentage and number of users who dropped off per Step.
If you select a GroupBy, you will see several bars representing each GroupBy group. Bars of the same color represent the same group. When you hover your mouse pointer over a bar, the bars of the same color will be highlighted.
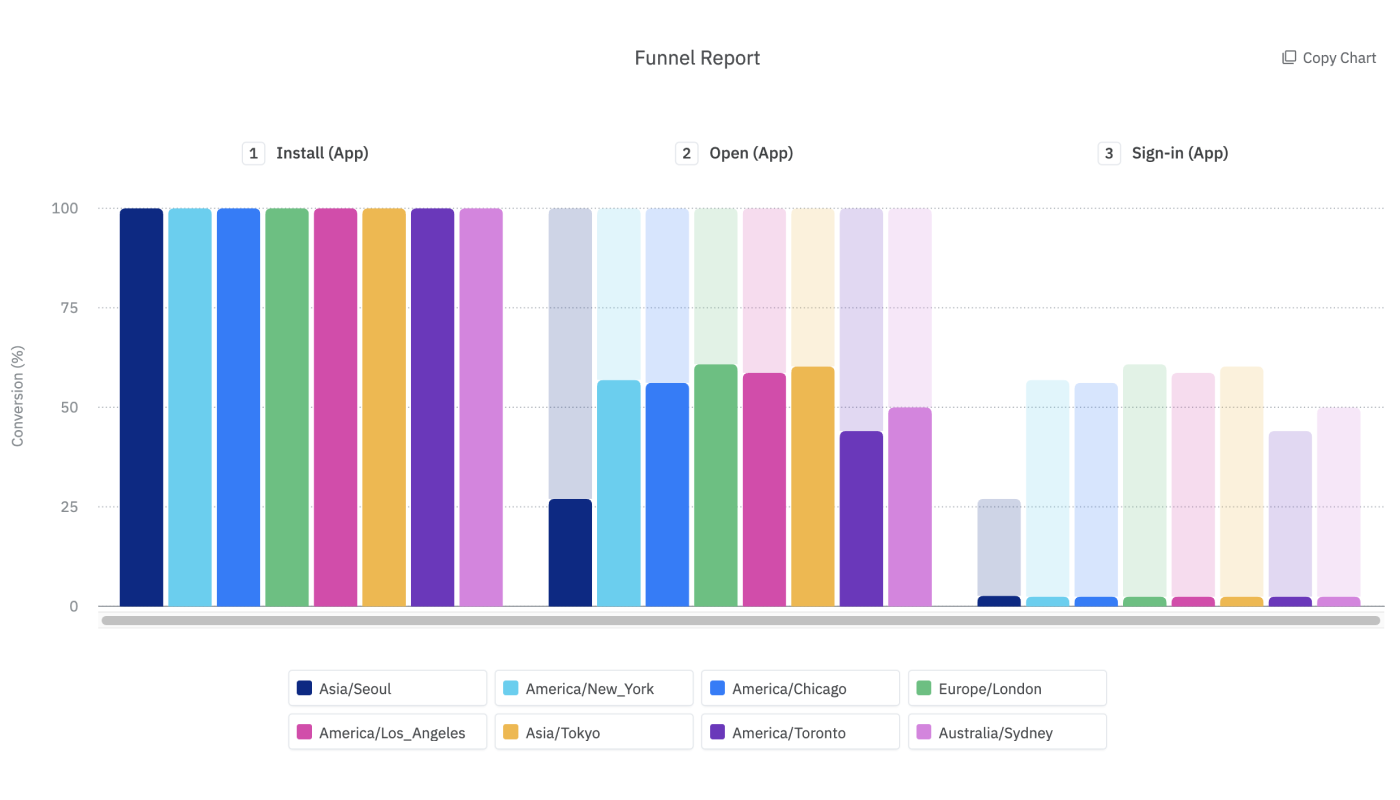
You can remove the bars of a particular GroupBy group from the chart by clicking on a GroupBy group in the legend. The bars representing the particular group return to the chart when you click on it again.
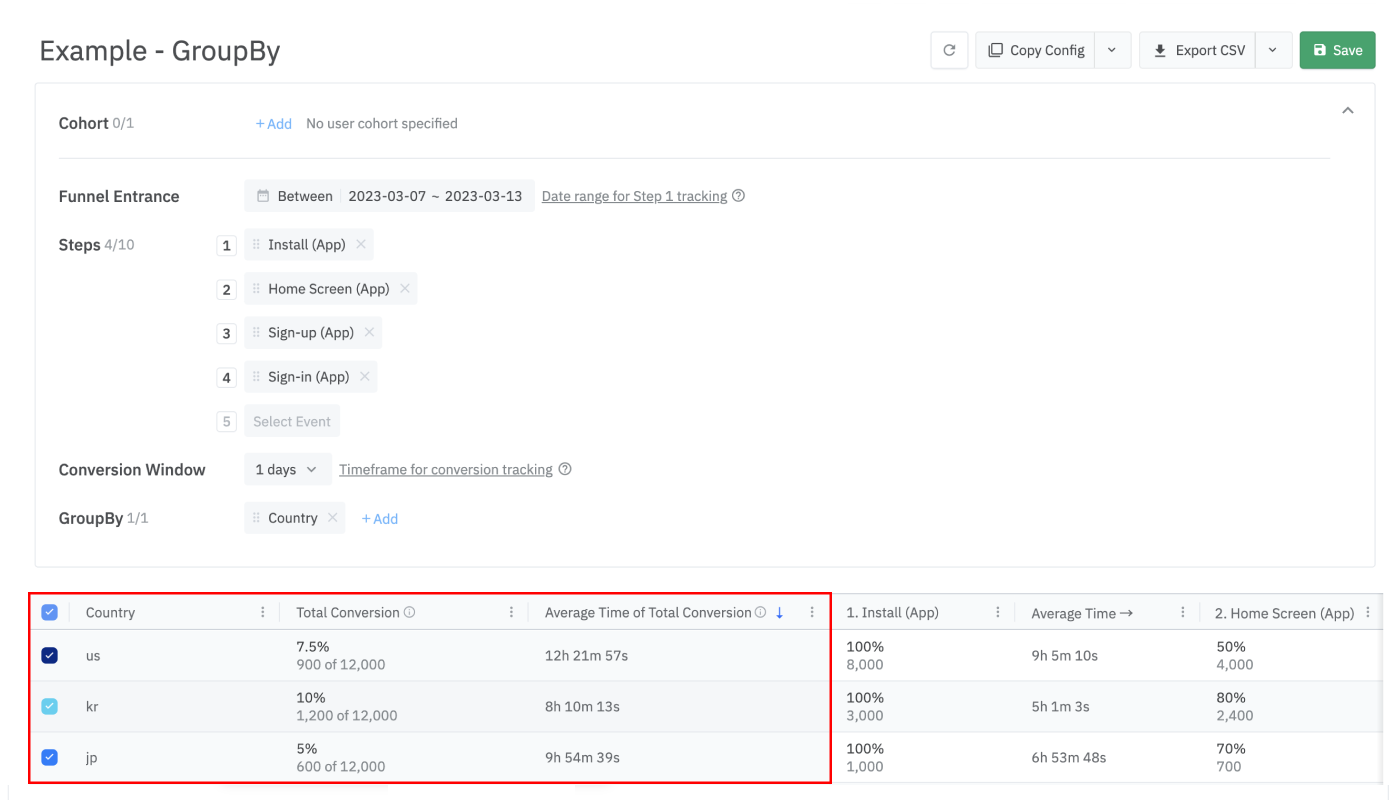
The table provides the following information.
Total Conversion: The overall conversion rate and the number of users who converted through the funnel.
Average Time →: The average time it took users to convert from the previous Step to the selected Step.
Average Time for Total Conversion: The average time it took users to convert through the funnel.
For example, if the Average Step Time for Step 2 is 9h 5m 10s, it means that it took the users 9h 5m 10s on average to convert from Step 1 to Step 2. If the Average Conversion Time is 12h 21m 57s, it means that it took the users 12h 21m 57s on average to convert through the funnel from the first step to the last.
Save your report and open it whenever you need it. The saved reports can be used to easily share reports with Airbridge users with the app roles that allow them to view the reports.
Airbridge reports support various features, from saving reports to sharing them with others.
The table shows the general features supported by Airbridge reports. Some features are not available in certain reports.
Feature |
Description |
|---|---|
Refresh | Reload data with the existing report configuration. The time passed since the time the data was loaded appears next to the Refresh button or Copy Table button. |
Wide controls | Configure the report on a wider panel. |
Search | Search the report by keywords. |
Expand/Collapse | Expand or collapse the configuration box. |
Report naming | Name the report and save it for later use. |
Refer to the table below to learn how to share your report with others.
Feature |
Description |
User Guide |
|---|---|---|
Copy Config | Click Copy Config to share the report with other Airbridge users regardless of their app roles and access settings. | |
Share Report URL | The Report URL is the URL assigned to each Airbridge report. By sharing the report URL with other Airbridge users with the same access level as yours, you can share the same report view. | |
Grant App Access | Invite users to the Airbridge App and assign app roles. The data users can access depends on their app roles. | |
Copy Table | Click Copy Table and paste the table into a spreadsheet or a messenger. | |
Export CSV | Export the report as a CSV file or a Google Spreadsheet file. | |
Use Sharelinks | Sharelinks are URLs where anyone can download a CSV file that contains the Actuals Report data without accessing the Airbridge dashboard. The data shared through the Sharelink is the data that is accessible with the app role of the Airbridge user who created the Sharelink. |
Following Meta's privacy policy, Meta Ads campaign data is masked in Airbridge until you accept Meta's Advanced Mobile Measurement (AMM) Terms, provided that both of the following conditions are met for the set date range:
The sum of impressions and engaged views from Meta Ads campaigns is less than 1,000
The Meta Ads campaign data is imported to Airbridge through channel integration and cost integration
The masked data will be displayed as follows instead:
Display | Description |
|---|---|
Privacy Block | All data is masked; only "Privacy Block" will be displayed |
+α, ±α | Data is partially masked |
Note
To gain full visibility of your Meta ads campaign data in Airbridge reports, you need to accept Meta’s Advanced Mobile Measurement (AMM) Terms. Otherwise, Meta ads campaign data remains masked in Airbridge. For more information about Meta's AMM terms, refer to this article.
If Meta Ads data is still not visible after agreeing to the terms, you may try changing your report settings as follows:
Change or extend the date range. Only data from periods after consent is provided in raw data.
Change or remove some of the GroupBys and filters.
The table below outlines the features and limitations of the Funnel Report.
Supported features and limitations |
Description |
|---|---|
No. of Events (Steps) configurable | 40 |
No. of GroupBys configurable | 3 |
Self-serve Metrics, Calculated Metrics, Custom GroupBys | Not supported |
Timezone | The configured Airbridge App timezone |
Data visualized in | Tables, charts |
Data refresh cycle | 1 hour |
Aggregated data | App event data, web event data |
Custom events | Supported |
Data available of | 6 months (From D-175 to D-0) |
Maximum date range configurable for a single report view | 175 days |
When “User” is selected as the identifier, the funnel entrance date range can be configured starting from October 1, 2023.
When the funnel entrance date range starts earlier than October 1, 2023, the “User” option is disabled and can’t be selected.
Even if a Funnel Report is configured with the same steps, the results may differ depending on the selected identifier. When the aggregation is based on users, the report uses Airbridge ID as the identifier, which generally results in lower overall numbers.
For analyzing web-to-app user journeys, it is recommended to set the identifier to "User". Airbridge IDs are well-suited for tracking user journeys across multiple platforms. For more details, refer to this article.
Was this helpful?