Sharing Funnel Analysis Data in Real-Time Using Sharelinks
The Sharelink allows you to share your Funnel Report using a simple link. Anyone with a Sharelink can download a CSV file that contains the Funnel Report data without accessing the Airbridge dashboard.
Attention
The data shared via Sharelinks is the data from the report view you have created and have access to in the Airbridge dashboard.
Keep in mind that when you share Sharelinks, there are potential risks of exposing sensitive data unintentionally. Anyone with the Sharelink can import the report data, even if they don't have access permission or aren't Airbridge users.
Sharelinks can be created only for saved Airbridge reports. When entering the Sharelink into the address bar of a web browser, the report data is downloaded as a CSV file.
The data in the downloaded CSV file has the same identifier, cohort, funnel entrance date range, GroupBy, and language settings as the original report.
Parameters can be added to customize some of the settings. Refer to this section of the article to learn more.
Attention
Sharelinks can be created only for saved reports. The [share] icon is only visible in saved reports. If you can't see the [share] icon in your report, save the report first.
You need to have a saved Funnel Report to create a Sharelink. If you don't have a saved Funnel Report, save a report view first.
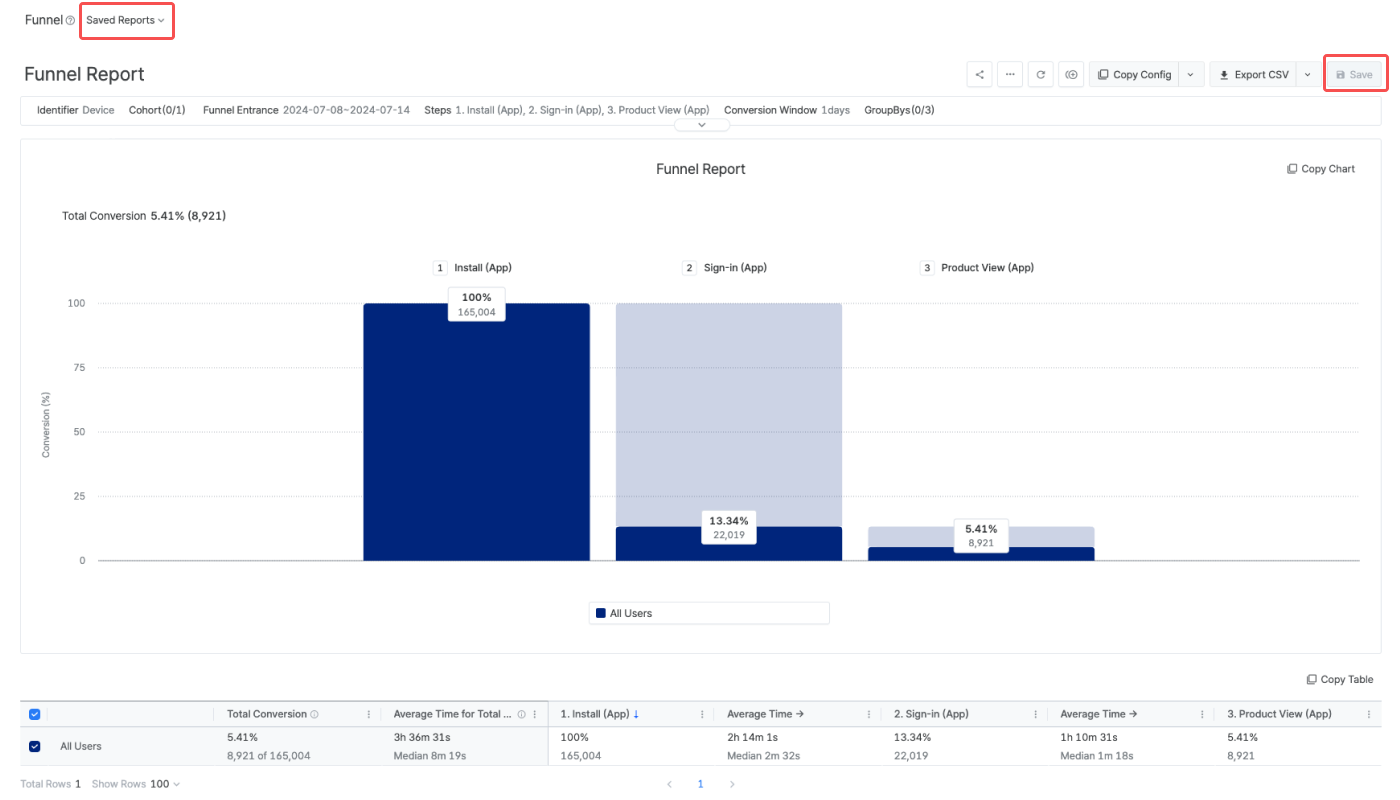
1. Click Saved Reports at the top right to open the report you want to share from the drop-down list. Or, if you want to create a Sharelink of the report you have just created, click Save at the top right.

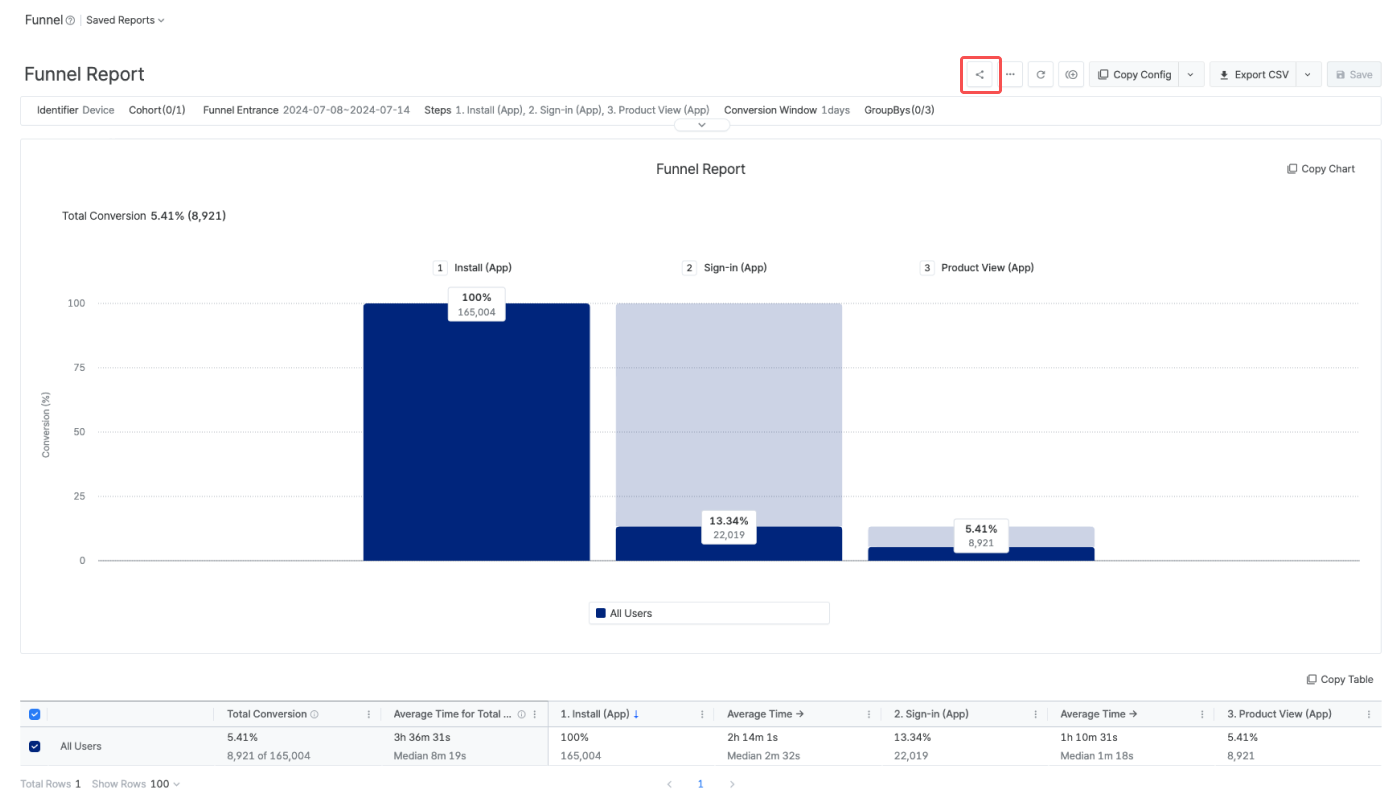
2. Click the [share] icon on the top right.

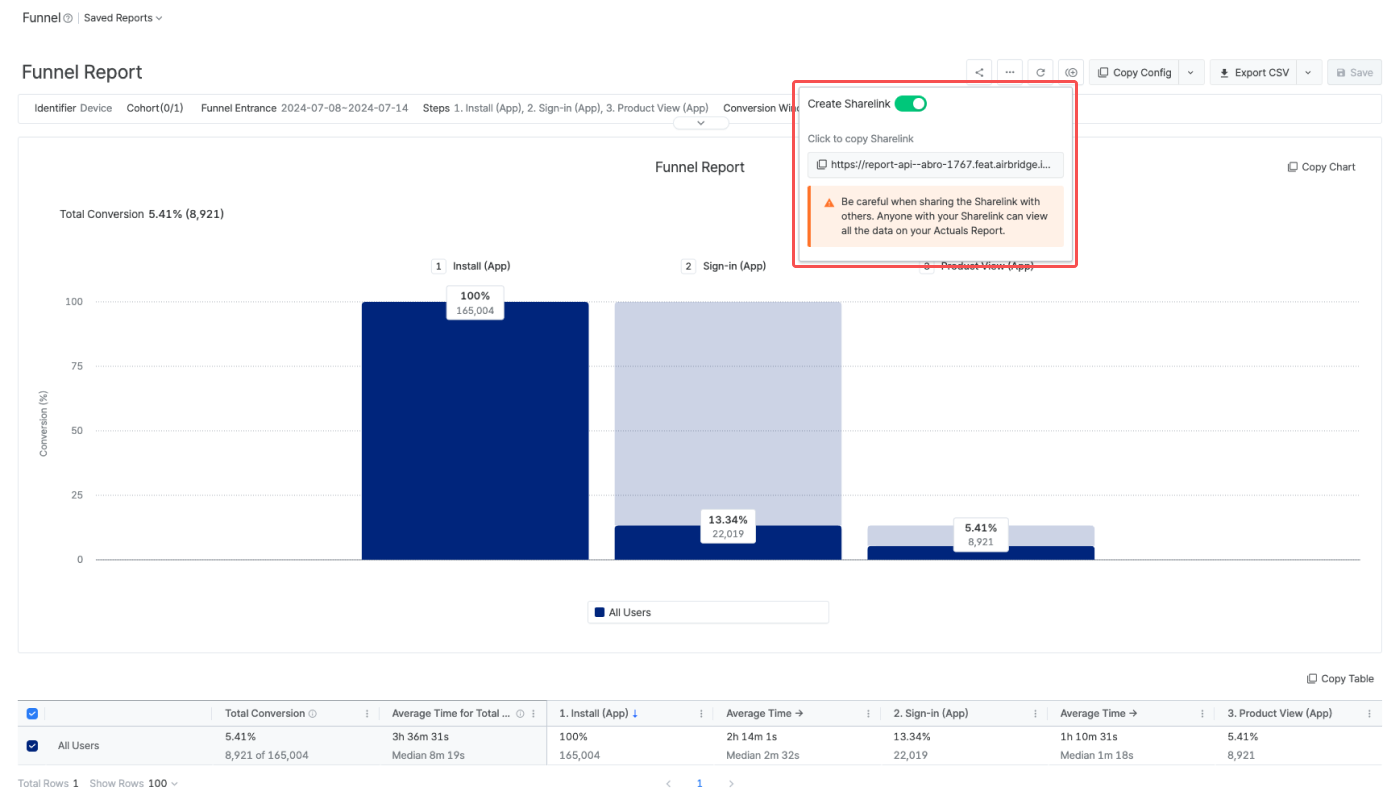
3. Switch on the [Create Sharelink] toggle. A Sharelink will appear below the toggle.

4. Click the Sharelink below the toggle to copy it. Share the Sharelink with anyone you want to share your report data. Note that if the toggle is turned off, the Sharelink won’t work anymore. Every time you switch on the toggle, a new Sharelink is created, and the new link must be shared.
The Sharelink can be customized by adding new parameters or editing the existing parameters to modify the settings in the data. The structure of a Sharelink looks like the following.
Sharelink structure:
Basic URL?parameter1¶mter2¶meter3Basic URL:
report.airbridge.io/funnel/(URL).csv
The data in the downloaded CSV file has the same indentifier, cohort, funnel entrance date range, steps, conversion window, GroupBy, and language settings as the original report. The CSV file downloaded from a Sharelink can carry up to 1,000 rows by default.
By adding parameters or editing the existing parameters, the Sharelink can be customized to modify the settings in the data, such as the language settings, date range, number of rows, etc. A question mark (”?") must be present at the end of the URL before the parameters. For example, by adding the rowNo parameter to the Sharelink, up to 10,000 rows can be downloaded.
The following table lists the parameters that are available.
A Sharelink can have only 1 of the 3 parameters that are related to date range settings (from, since, last). Those parameters can be configured for up to 180 days.
The table below lists the parameters available for customizing Sharelinks of Funnel Reports.
Parameter |
Description |
Format |
Example |
|---|---|---|---|
from, to | Sets a specific date range for the funnel entrance | YYYY-MM-DD | from=2024-01-01&to=2024-03-01 |
since | Sets the date range from a specific date to today | YYYY-MM-DD | since=2024-01-01 |
last | - Sets the date range to the last n days. - The date range does not include today unless n=0. | 0 | last=3 |
offset | - Changes the last date of the date range from today to n days before today. - This must be used together with date range parameters. | Natural numbers | offset=3 |
rowNo | - Provides the top rows in n rows. - Can be configured to max. 10,000 rows. | Natural numbers | rowNo=5000 |
language | - Changes the language settings of the Sharelink. - If not specified, the same language as the Airbridge dashboard is applied. | en, ko | language=en |
isNowEnabled | - Used with the - If this parameter is not used, | true, false | isNowEnabled=false |
includesMetadata | - Includes the report config info in the CSV file. - If this parameter is not used, | true, false | includesMetadata=true |
useViewFormat | - Sets the data display format for values that include special characters such as - - | true, false | includesMetadata=true |
Note
To gain full visibility of your Meta ads campaign data in Airbridge reports, you need to accept Meta’s Advanced Mobile Measurement (AMM) Terms. Otherwise, Meta ads campaign data remains masked in Airbridge. For more information about Meta's AMM terms, refer to this article.
When adding multiple parameters, separate them with an ampersand ("&").
Attention
The language parameter is present in all Sharelinks by default. To add more parameters, use ampersands (”&”) between parameters.
A Sharelink starts with “report.airbridge.io/retention/(URL).csv” followed by a question mark and parameters. See the following examples to understand how to customize Sharelinks.
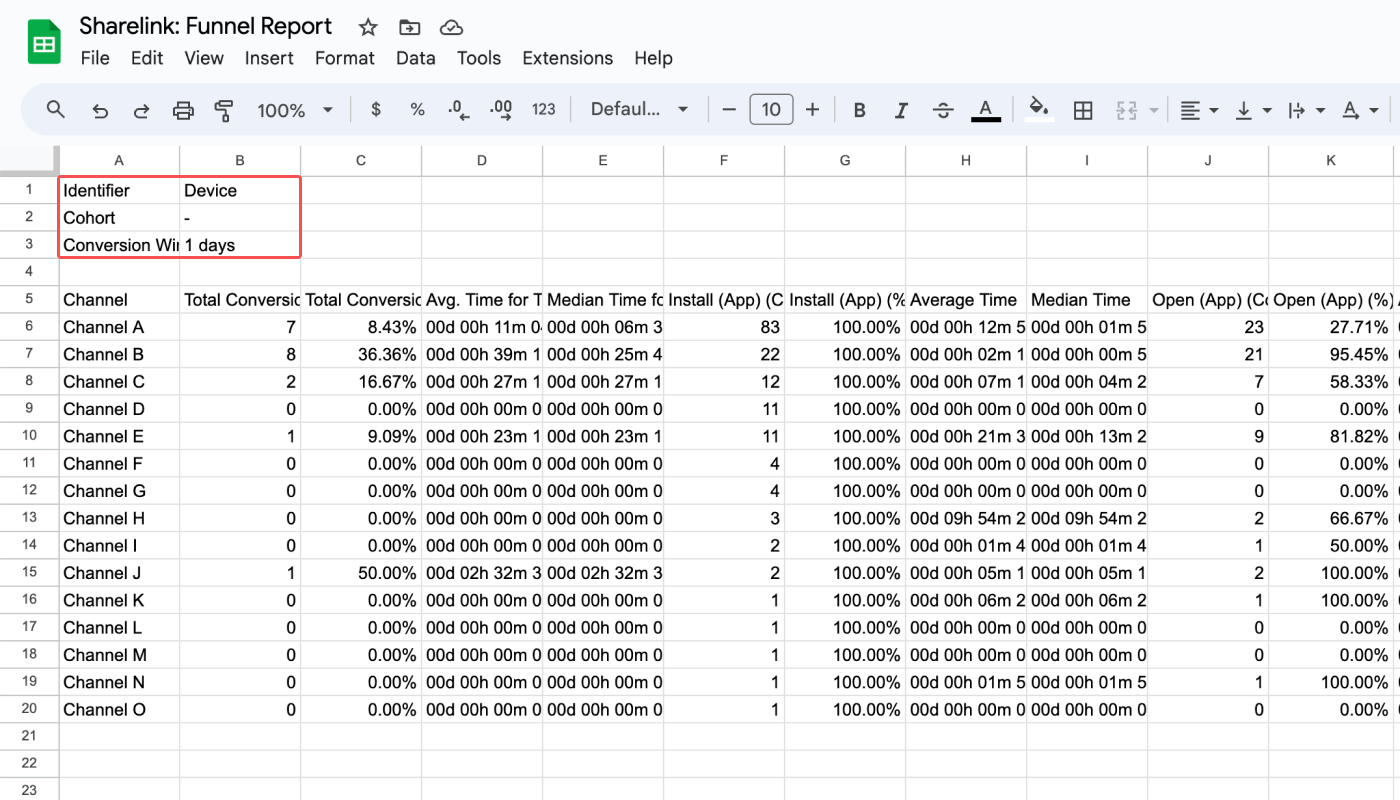
report.airbridge.io/funnel/(URL).csv?includesMetadata=true
In the above Sharelink, includesMetadata=true indicates that the CSV will contain the report config info like the following.

report.airbridge.io/funnel/(URL).csv?last=4&offset=3&isNowEnabled=true&language=ko
In the above Sharelink, last=4 and isNowEnabled=true indicate that the data included in the CSV file will contain the last 4 days' worth of data, including today. offset=3 indicates that the funnel entrance date range starts 6 days earlier and ends 3 days earlier than today.
language=en indicates that the language is set to English.
report.airbridge.io/funnel/(URL).csv?language=en&last=210
In the above Sharelink, last=210 indicates that the data included in the CSV file will contain the last 210 days' worth of data, not including today (appx. 7 months).
However, the maximum date range supported is 180 days, and therefore, this Sharelink won’t work properly.
report.airbridge.io/funnel/(주소).csv?rowNo=3000&language=ko
In the above Sharelink, rowNo=3000 indicates that the CSV file will contain 3,000 rows of data. language=ko indicates that the language is set to Korean.
When the rowNo parameter is absent, the CSV file can contain up to 1,000 rows. If you want to see more top rows, add the rowNo parameter. The maximum supported number of rows is 10,000.
Attention
The following settings in the CSV file downloaded from Sharelinks cannot be modified by adding parameters to the Sharelink and will be the same as the settings of the Airbridge dashboard.
Identifier, cohort, steps, conversion window, GroupBy
If you want to modify the above settings, modify them in the Funnel Report in your Airbridge dashboard and save the changes.
It takes about an hour for the changes to be applied to the already shared Sharelink. If you want to see the changes immediately, open the data in a new Google Spreadsheet file. Or, switch off the [Create Sharelink] toggle and switch it on again to create a new Sharelink. Then, copy the new Sharelink for your data-sharing purposes.
The report data can be imported to Google Spreadsheets using the importdata function. Use the importdata function like the following example.
=
importdata("Full Sharelink")
The report data is pulled every 1 hour, allowing for near-realtime data monitoring on Google Spreadsheets. By using Sharelinks and the importdata function, you can create your own custom report that combines Airbridge data with data from any other source.

Troubleshooting conversion rate errors in the Google Spreadsheet
The conversion rate may show in numbers instead of percentage. In such a case, select all cells that contain the retention rate value, select [Format] from the top menu bar, and select [Number]>[Percent]. Or, click the [percentage] icon in the format menu bar.
By importing the Funnel Report data using Sharelinks and Google Spreadsheets, you can share the Funnel Report data in your desired format regardless of the app access permissions in Airbridge. The Sharelinks and Google Spreadsheets will come in handy for the following purposes:
Sharing Airbridge data externally, regardless of access permissions
Monitoring the Airbridge data in Google Spreadsheets in real-time
Creating a custom report by integrating Airbridge data with internal company data
When you share data using Sharelinks, you're providing access to the report view you've created in the Airbridge dashboard. It's important to note that anyone with the Sharelink can import the report data, regardless of their access permissions or whether they are Airbridge users.
This feature allows you to easily share data with others without the need for them to be Airbridge users or log in to the dashboard, making it a convenient option for collaboration.
Was this helpful?