- Marketers Guide
- Reporting
- Airbridge Reports Overview
Airbridge Reports Overview
Level up your marketing strategies with various Airbridge reports that allow you to gain insights into your ad performance and user data from different perspectives.
Airbridge visualizes the data collected through various means into different report types. To fully leverage the Airbridge reports, additional actions may be required, such as defining event values and implementing cost integration with ad channels. You need to request access to some reports.
Airbridge Report |
Data Format, Key Metrics | Description |
|---|---|---|
Actuals Report | - Table - Installs, Deeplink Opens, Clicks, etc. | Monitor ad performance in real-time |
Trend Report | - Time-series chart and table | Monitor the granular trend of the ad performance |
Reinstall Report | - Table - Reinstalls | Monitor the number of reinstalls |
Retention Report | - Table - Retention rate, number of retained users, Predictive lifetime | Monitor the retention metrics of a specific cohort at different granularity |
Funnel Report | - Chart and table - Number of users converted through the funnel, step-by-step conversion rate, number of drop-offs, etc. | Analyze the user behavior using the funnel steps |
Revenue Report | - Chart and table - Revenue, Paying users, ROAS, CAC, Predictive LTV | Monitor the revenue metrics of a specific cohort in different granularity |
Active Users Report | - Chart and table - DAU, WAU, MAU, ARPU, ARPPU | Monitor the user count metrics in different granularity |
Touchpoint Analysis Report | - Chart and table - Number of touchpoints | View the number of touchpoints generated by a user prior to conversion |
Touchpoint Overlap Report | - Chart and table - Number of overlapping touchpoints | View the overlapping touchpoints across channels |
Lag Time Report | - CTIT | Monitor the CTIT data to validate suspicious touchpoints |
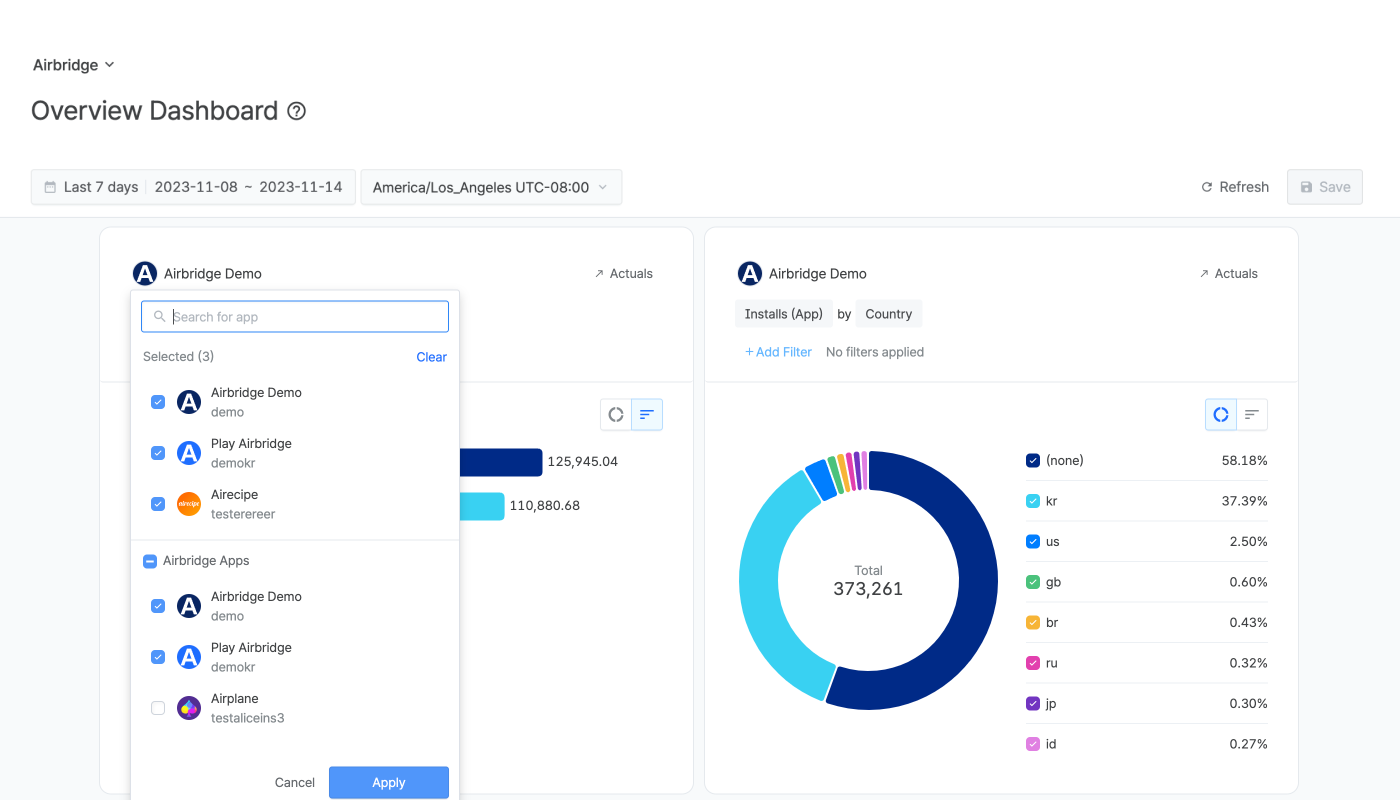
The Overview Dashboard provides a quick summary of your ad performance across multiple apps. It's also helpful for Airbridge users with a single app, as the metrics widgets offer a simple overview of their app's performance.
To view the data in depth, jump directly to the Actuals Report or Trend Report, where you can set up multiple metrics, GroupBys, and filters.

Refer to the article below to learn how to use the Overview Dashboard.
Airbridge offers a variety of reports to meet your marketing needs. Refer to the information below to find the right Airbridge report for your specific purpose.
The Actuals Report is a quick and easy way to see how your ads are performing. You can select different metrics to visualize the data you want to view. Configure GroupBys to aggregate the data by channel, campaign, platform, etc.
The Trend Report is a time series analysis of your Actuals Report data that provides a quick visual trend overview of your ad performance.
Monitor user retention in the Retention Report to see how many users continue to use your service. The Active Users Report provides an instant view of key metrics such as DAU and MAU, to track the health of your service.
The Revenue Report is dedicated to presenting various revenue metrics at the chosen granularity. You can view the revenue generated by users who installed or returned to your app during the set date range.
The Revenue Report can be accessed by the Owner, In-house Marketer users, and Agency users with access permission only.
In the Funnel Report, you can create your own funnel by configuring steps to see how many users dropped off between steps or converted through the funnel. The data is visualized in tables and charts to help you understand user behavior easily.
The Lag Time Report provides a distribution of the time it took from an ad click to app installation. When ad fraud, such as click injection or click spamming, occurs, you can see a deviation from the normal distribution.
You can also set up fraud validation rules to flag suspicious touchpoints and conversions across Airbridge reports.
Learn about the additional features of Airbridge reports in the following articles.
Was this helpful?