Touchpoints Overlap Report
The Touchpoints Overlap Report allows you to see how many touchpoints, by channel, overlapped before a user converted. When selecting the advertising channels that make up your media mix, consider referring to the results of the Touchpoints Overlap Report.
You can configure the analysis range, granularity, date range, GroupBy, and filter to create a report view.
Click the arrow icon next to the chart title to open the analysis range config box. You can click Install, 1st Purchase, or 2nd Purchase to set the user journey for analysis. A flag will show on top of the conversion you choose.
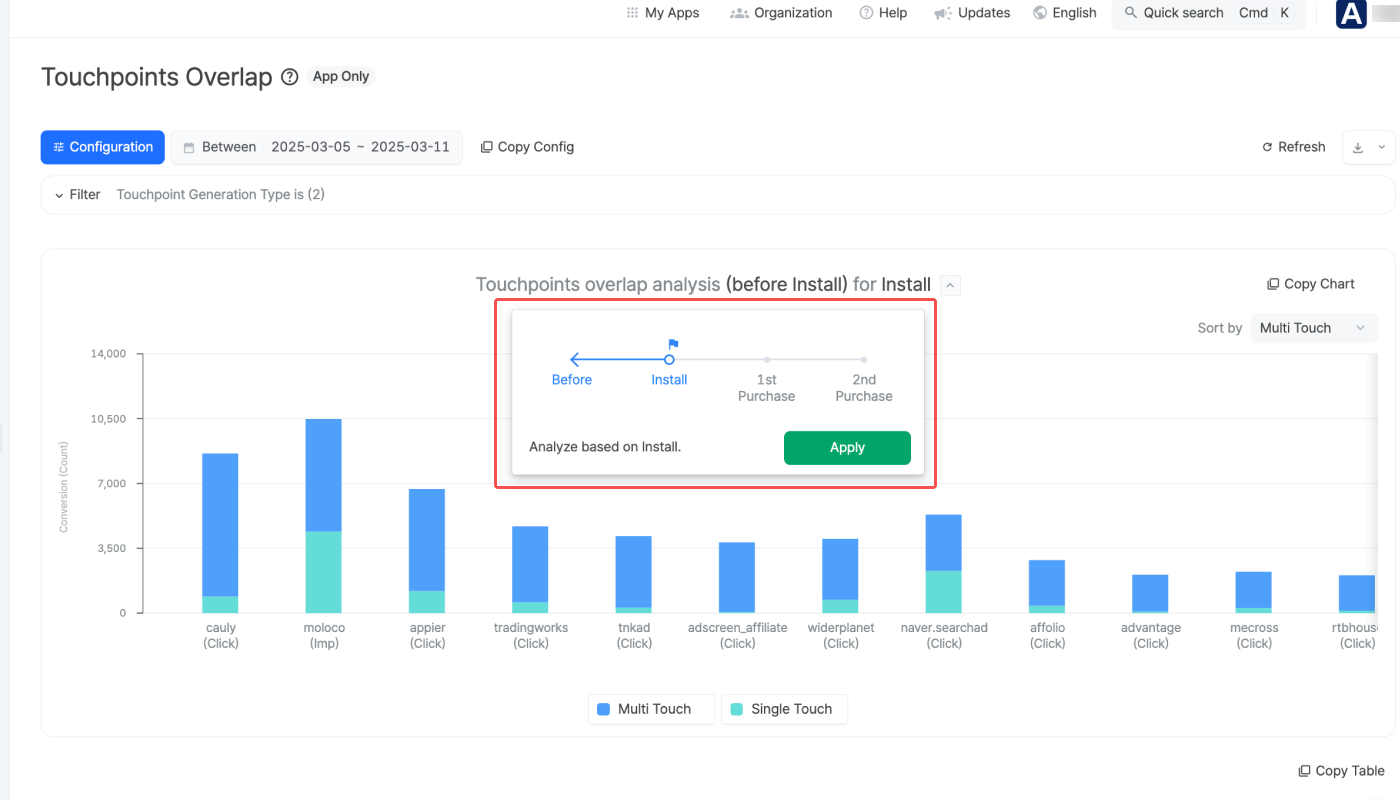
Read on to learn how you can set the analysis range differently.
When selecting Install, the analysis range can be set as below.
Before- Install: The report will shows the touchpoint data that occurred before app install.
When selecting 1st Purchase, the analysis range can be set as below.
Before - 1st Purchase: The report will shows the touchpoint data that occurred before 1st Purchase.
Install - 1st Purchase: The report will shows the touchpoint data that occurred between app install and first purchase.
When selecting 2nd Purchase, the analysis range can be set as below.
Before - 2nd Purchase: The report will shows the touchpoint data that occurred before the second purchase
Install - 2nd Purchase: The report will shows the touchpoint data that occurred between app install and second purchase.
1st Purchase - 2nd Purchase: The report will shows the touchpoint data that occurred between the first and second purchase.
The Touchpoints Overlap report aggregates the touchpoint data based on the conversions (Install, 1st Purchase, 2nd Purchase) that occurred during the set date range. The date range be set up to 31 days, including today.
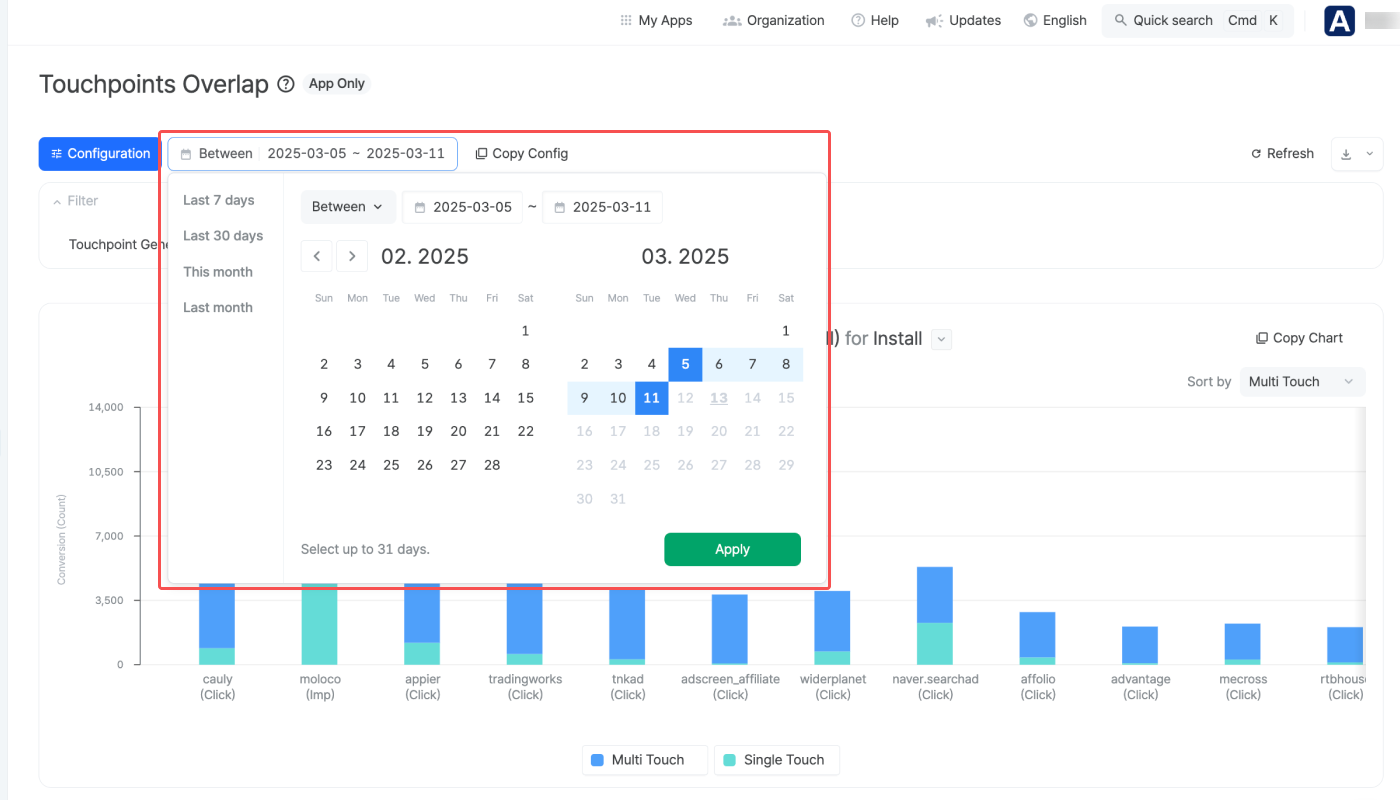
For more details about the date range settings, refer to the information below.
The date range can be set using the following conditions.
Condition | Date Range |
|---|---|
Between | From start date to end date |
Since | From start date to today |
Last | Last n days/weeks/months until yesterday |
When using “Last,” options such as “Include today,” “Include this month,” and “Offset” can be added.
For example, if you select Last 30 days and add Offset + 3 days, the date range will start 33 days before today and end 4 days before today.
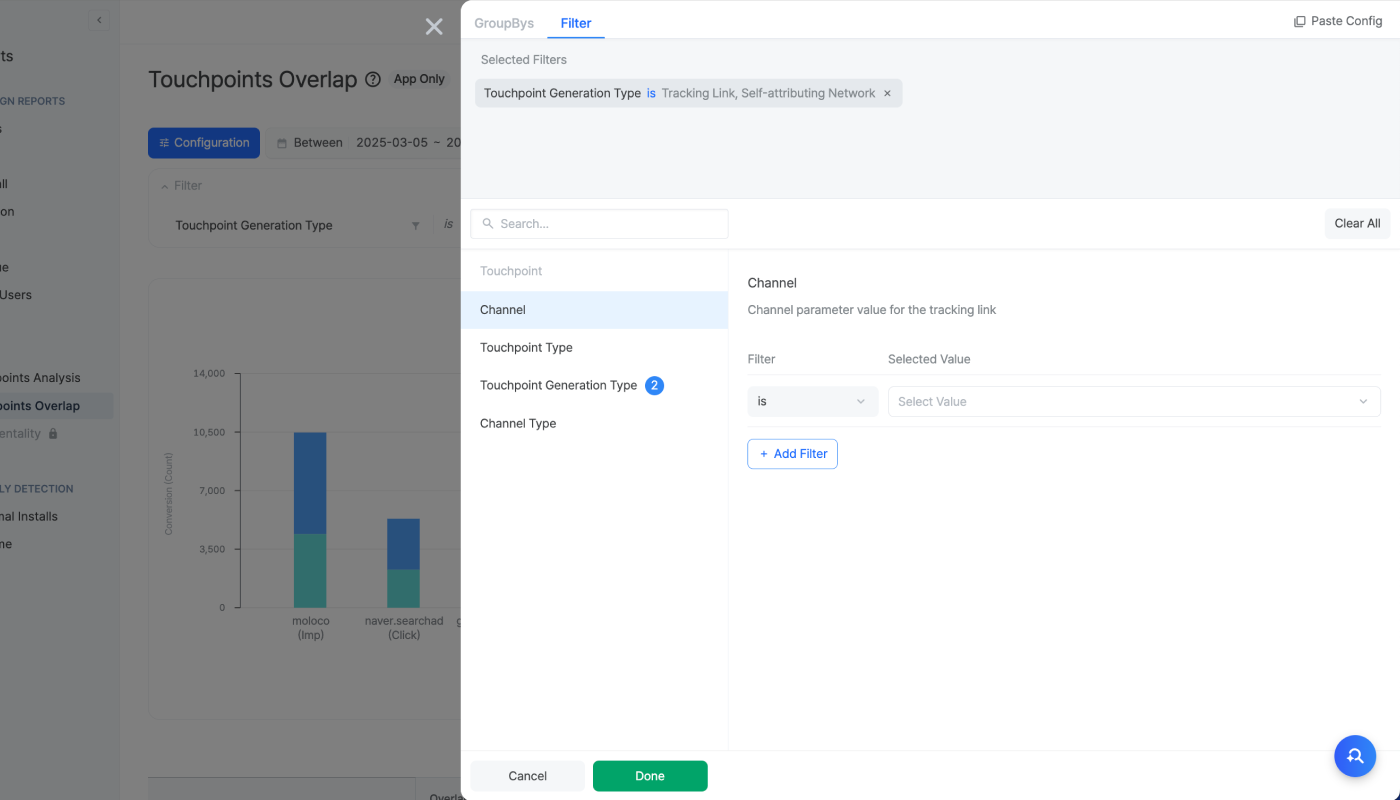
Click Configuration to configure the GroupBys and filters.
GroupBys are used to split the data into groups. The Channel is set as a default GroupBy and cannot be removed. The following GroupBys are supported in the Touchpoints Overlap report:
Touchpoint Generation Type
Channel Type
Filters can be configured to display specific data in the report. Note that the filters don't apply to the chart.
Once you configure the analysis range, granularity, date range, GroupBy, and filter in the Touchpoints Overlap report, you can see how many touchpoint occurred across channels and how much of them overlapped.
Attention
The filters are not applied to the chart. Only GroupBys are applied to the chart.
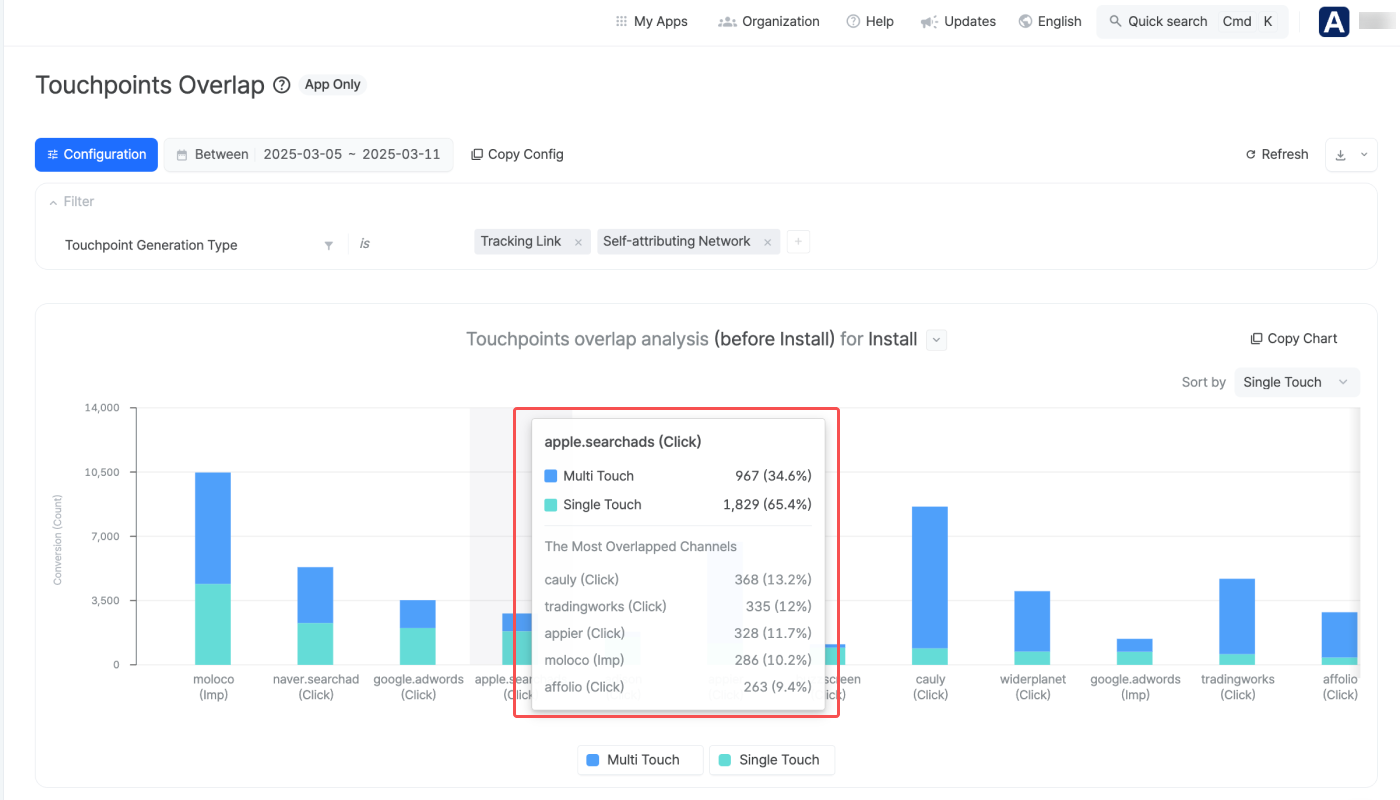
The bar chart shows the ratio of Single Touch and Multi Touch by channel. Each bar represents either click or impression data.
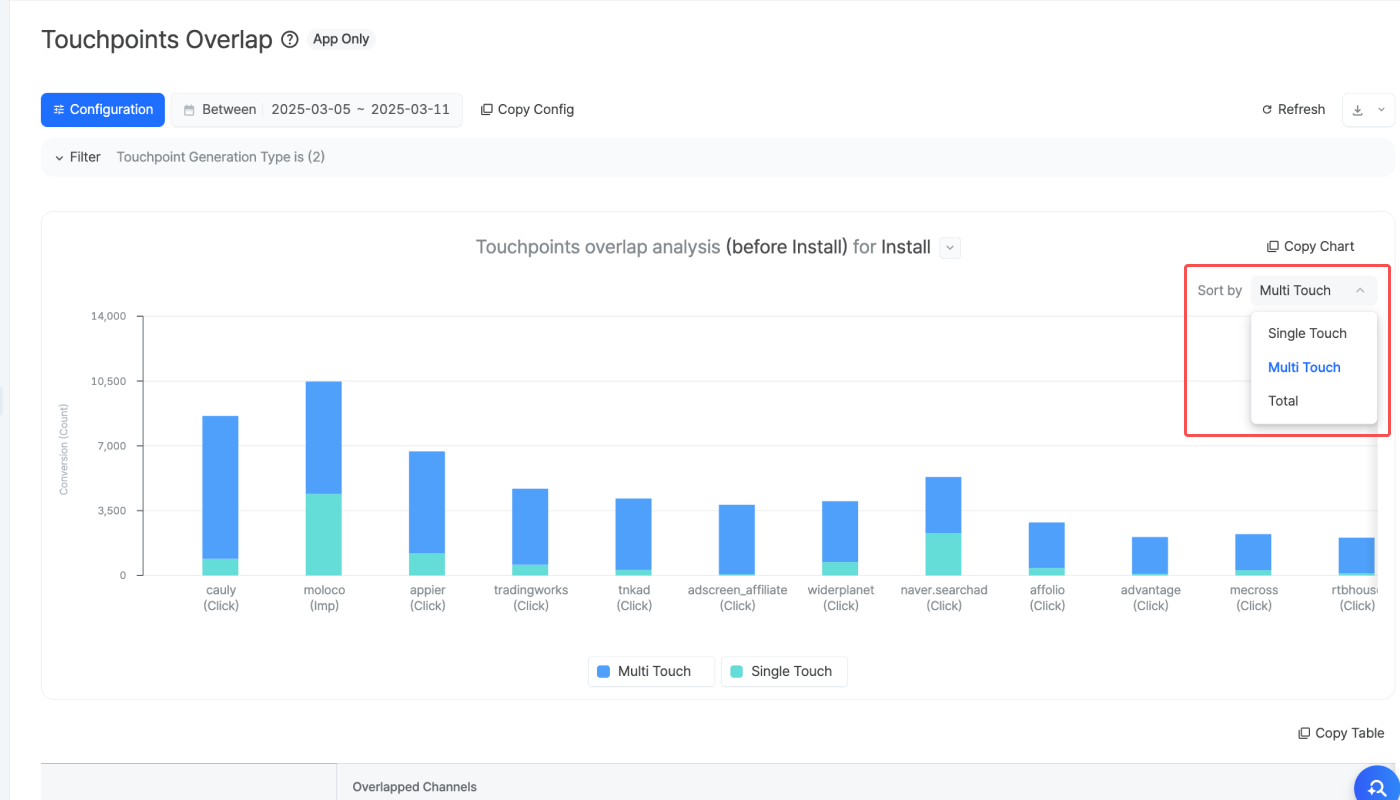
You can use the "Sort by" drop-down on the top-right of the chart to sort the data by different sort criteria.
Sort by |
Description |
|---|---|
Total | The data is sorted based on the total number of conversions attributed by the channel. |
Single Touch | The data is sorted in the order of channels where conversions occurred after a single touchpoint. |
Multi Touch | The data is sorted in the order of channels where conversions occurred after multiple touchpoints. |
The vertical axis of the chart represents the number of conversions that occurred. You can select the items you want to see in the chart from the legend located below it. This allows you to keep only the desired items for comparison among the items displayed in the chart.
By hovering over the chart, you can view the ratio of Single Touch and Multi Touch for each corresponding channel and touchpoint, as well as the channels where overlaps have occurred.
The table shows how touchpoints from various channels overlap. The darker the red color in a cell, the more touchpoints have overlapped. Refer to the example below.
See the example chart and table below.
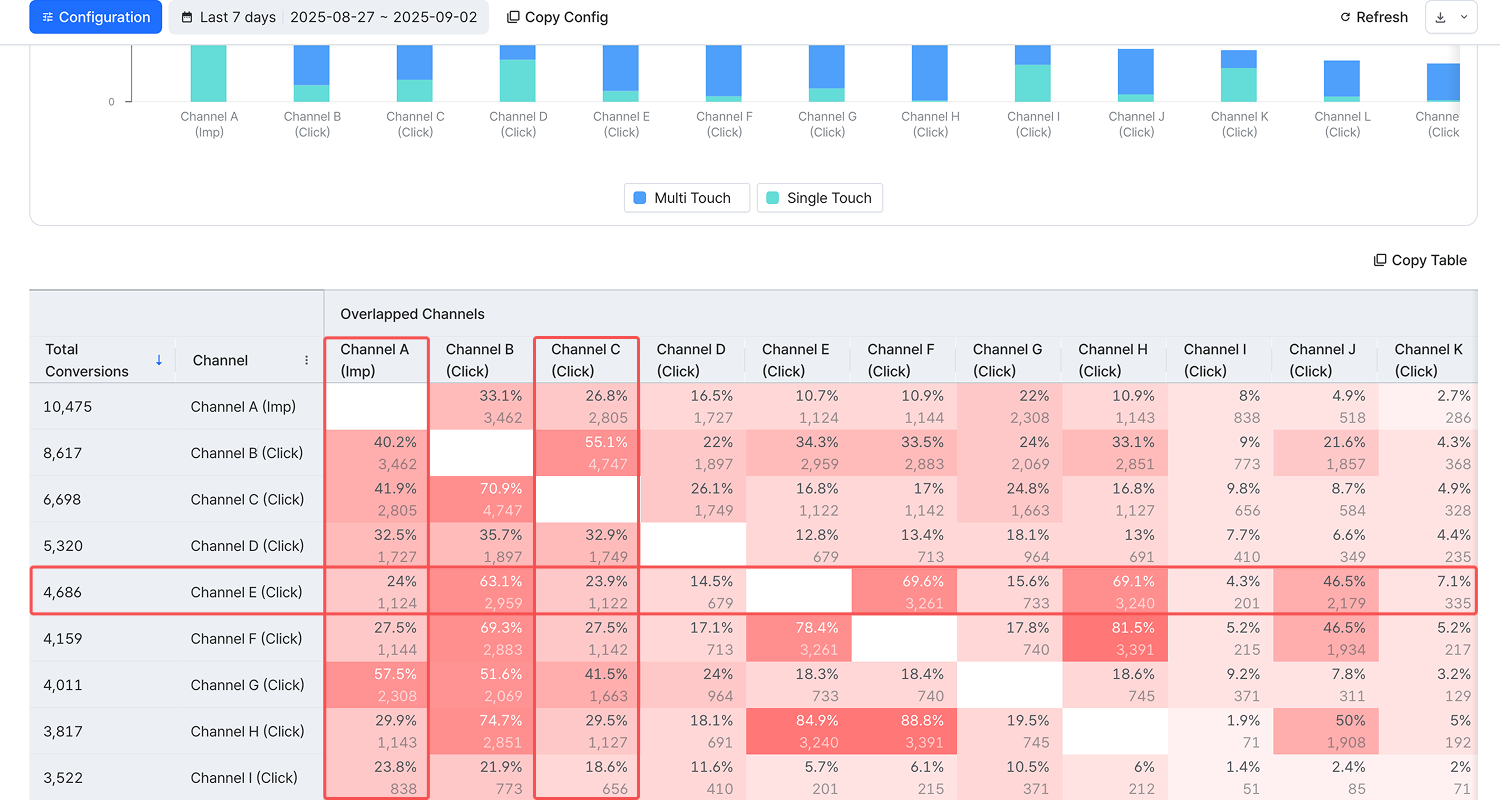
From Total Conversions on the left, you can see that 4,686 conversions were generated by Channel E’s click touchpoints.
Among these conversions, 1,124 also involved impression touchpoints from Channel A, and 1,122 also involved click touchpoints from Channel C.
It’s possible that some conversions involved both impression touchpoints from Channel A and click touchpoints from Channel C, since the cell showing the overlap between them is not zero.
Airbridge supports various features across its reports, from saving reports to sharing them with others.
The table shows the general features supported by Airbridge reports. Some features are not available in certain reports.
Feature |
Description |
|---|---|
Refresh | Reload data with the existing report configuration. The time passed since the time the data was loaded appears next to the Refresh button or Copy Table button. |
Wide controls | Configure the report on a wider panel. |
Search | Search the report by keywords. |
Expand/Collapse | Expand or collapse the configuration box. |
Report naming | Name the report and save it for later use. |
Refer to the table below to learn how to share the Touchpoints Overlap Report with others.
Feature |
Description |
User Guide |
|---|---|---|
Copy Config | Click Copy Config to share the report with other Airbridge users regardless of their app roles and access settings. | |
Grant App Access | Invite users to the Airbridge App and assign app roles. The data users can access depends on their app roles. | |
Copy Table | Click Copy Table and paste the table into a spreadsheet or a messenger. |
The table below outlines the features and limitations of the Touchpoint Overlap Report.
Supported features and limitations |
Description |
|---|---|
No. of GroupBys configurable | 3 |
Self-serve Metrics, Calculated Metrics, Custom GroupBys | Not supported |
Timezone | The configured Airbridge App timezone |
Data visualized in | Tables, charts |
Data refresh cycle | Real-time, except for user count metric data (1 hour) |
Aggregated data | App event data |
Custom events | Not supported |
Data available of | Past 6 months (From D-181 to D-2) |
Maximum date range configurable for a single report view | 31 days |
Was this helpful?