Creating an Active Users Report
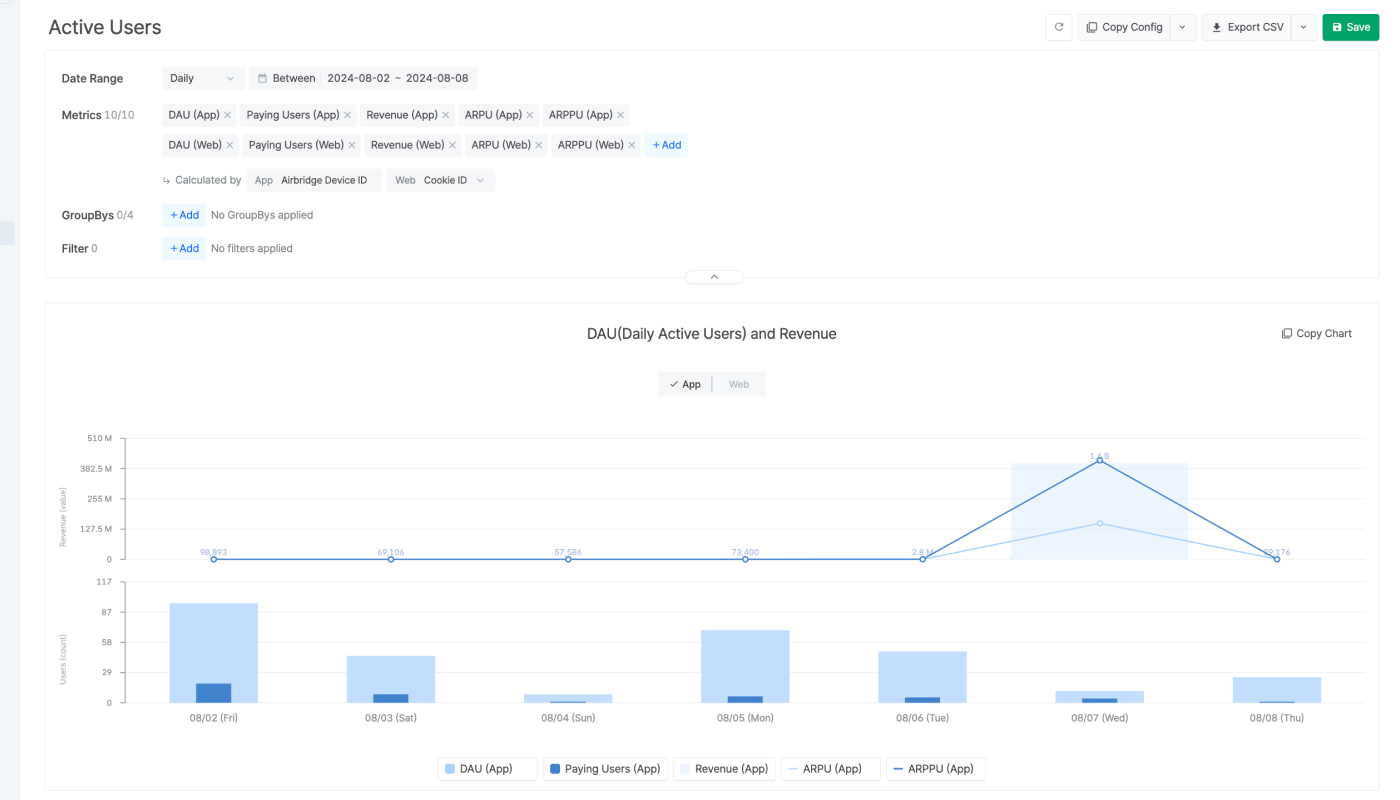
The Active Users Report allows you to monitor the DAU, WAU, MAU, and also other revenue related indicators such as Paying Users, ARPU, ARPPU in a chart and table.
Airbridge determines an active user as a unique user that performed one or more app or web event within the set date range. A unique user is a user that is identified to be unique by the identifier Airbridge uses for attribution.
Unique Users
The number of unique users is different from the number of events. Even though an event occurred 10 times during the set date range, the number of unique users is counted as 1 if all 10 events were performed by a single user. For more details on the identifiers used for determining unique users by reports, refer to this article.
From the Calculated by selector, you can set the identifier you want to use for determining unique users for aggregating active users.
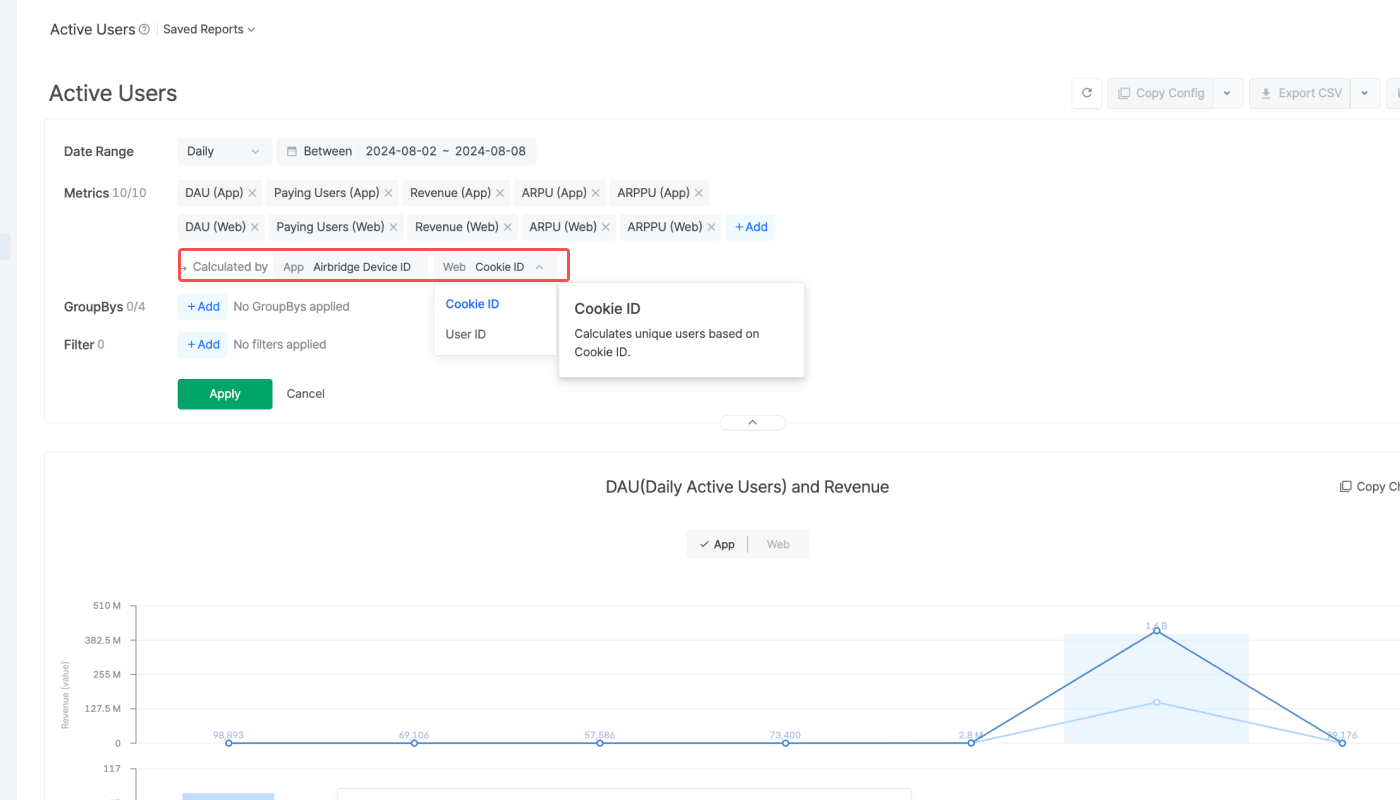
The configuration box offers options for configuring the granularity, date range, metrics, GroupBy, and filter to create a customized report view that suits your needs.
Configure the granularity and date range to create a report view.
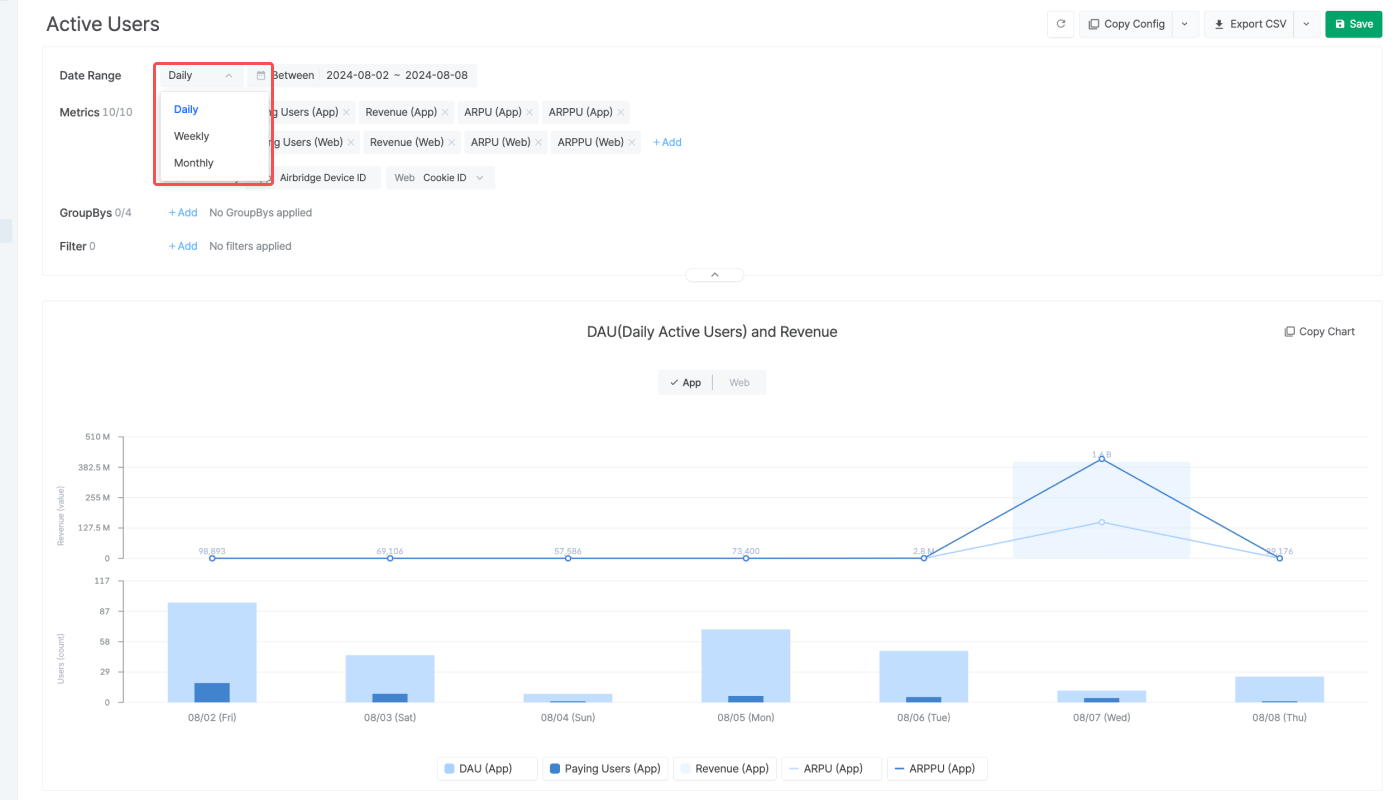
The Active Users Report shows data by the set granularity. The granularity options include Daily, Weekly, and Monthly.
Daily: 24 hours based on the configured Airbridge App timezone
Weekly: Maximum 7 days based on the set start of week
Monthly: Maximum 1 month
Let's say the date range was set as follows.
Date range: From January 30 (Fri) to February 10 (Tue)
The data will be displayed in different ranges in the dashboard depending on the set granularity. Refer to the table below.
Granularity |
Range |
No. of ranges in the dashboard |
|---|---|---|
Daily | Daily data from 1/30 (Fri) to 2/10 (Tue) | 12 ranges, from Day 0 to Day 11 |
Weekly (Start of the week: Monday) | - From 1/30 (Fri) to 2/1(Sun) | 3 ranges, from Week 0 to Week 2 |
Weekly (Start of the week: Friday) | - From 1/30 (Fri) to 2/5 (Thu) | 2 ranges, from Week 0 to Week 1 |
Monthly | - From 1/30 to 1/31 (January) | 2 ranges, from Month 0 ~ Month 1 |
Refer to the examples below to understand how data is displayed when selecting Weekly or Monthly for granularity.
Let's say the report settings have been configured as follows.
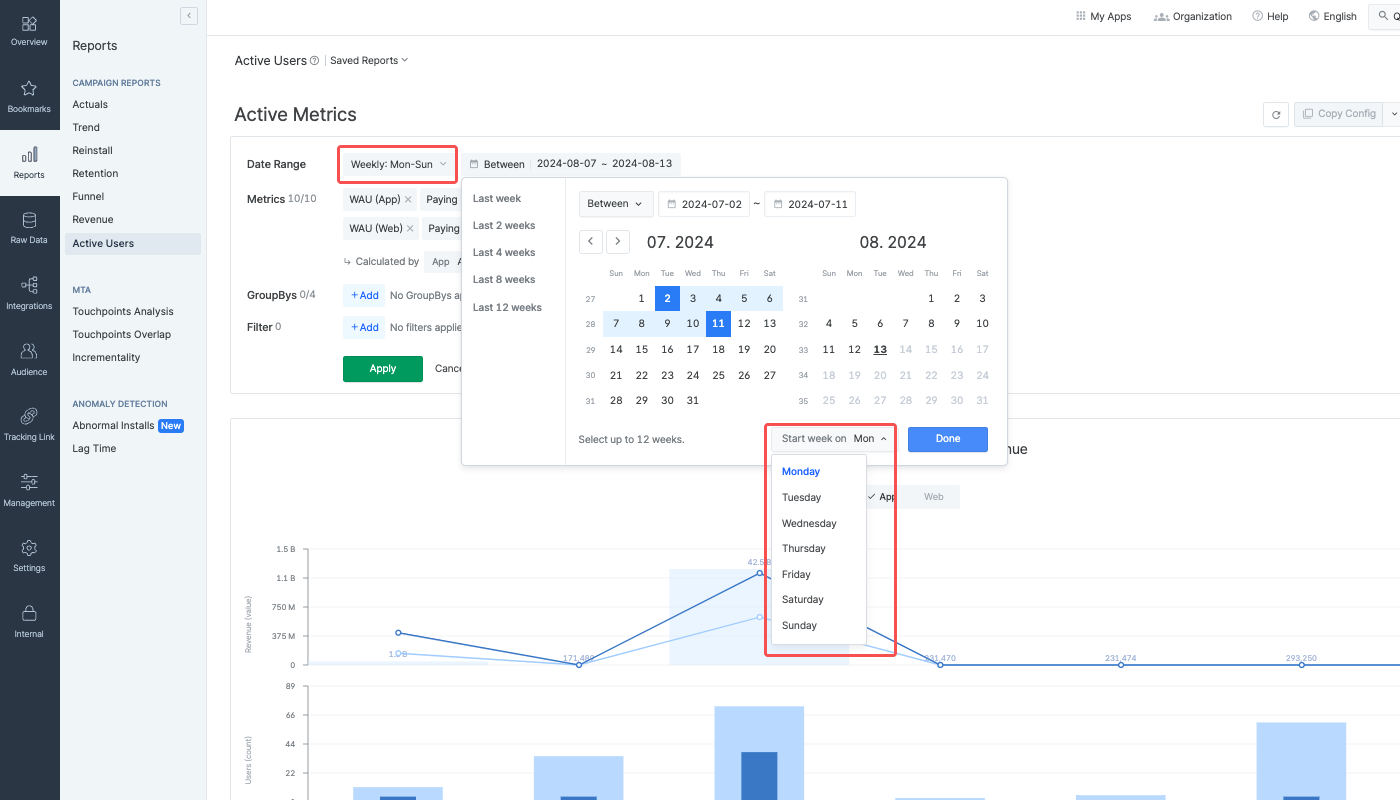
Granularity: Weekly
Start of the week: Monday
Date range: From 2024-07-02 (Tue) to 2024-07-11 (Thu)
The first range is from 2024-07-02 (Tue) to 2024-07-07 (Sun), which are 6 days. The second range is from 2024-07-08 (Mon) to 2024-07-11 (Thu), which are 4 days.
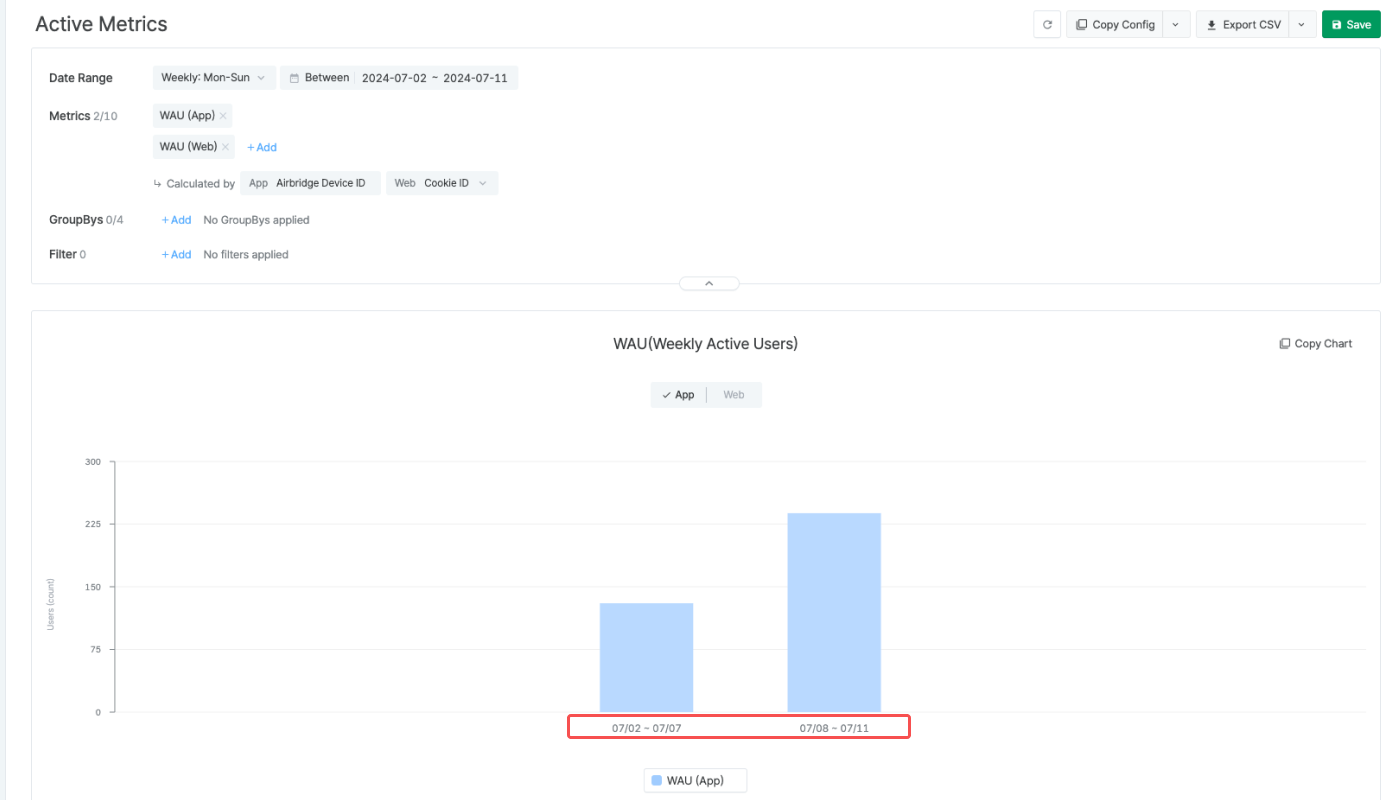
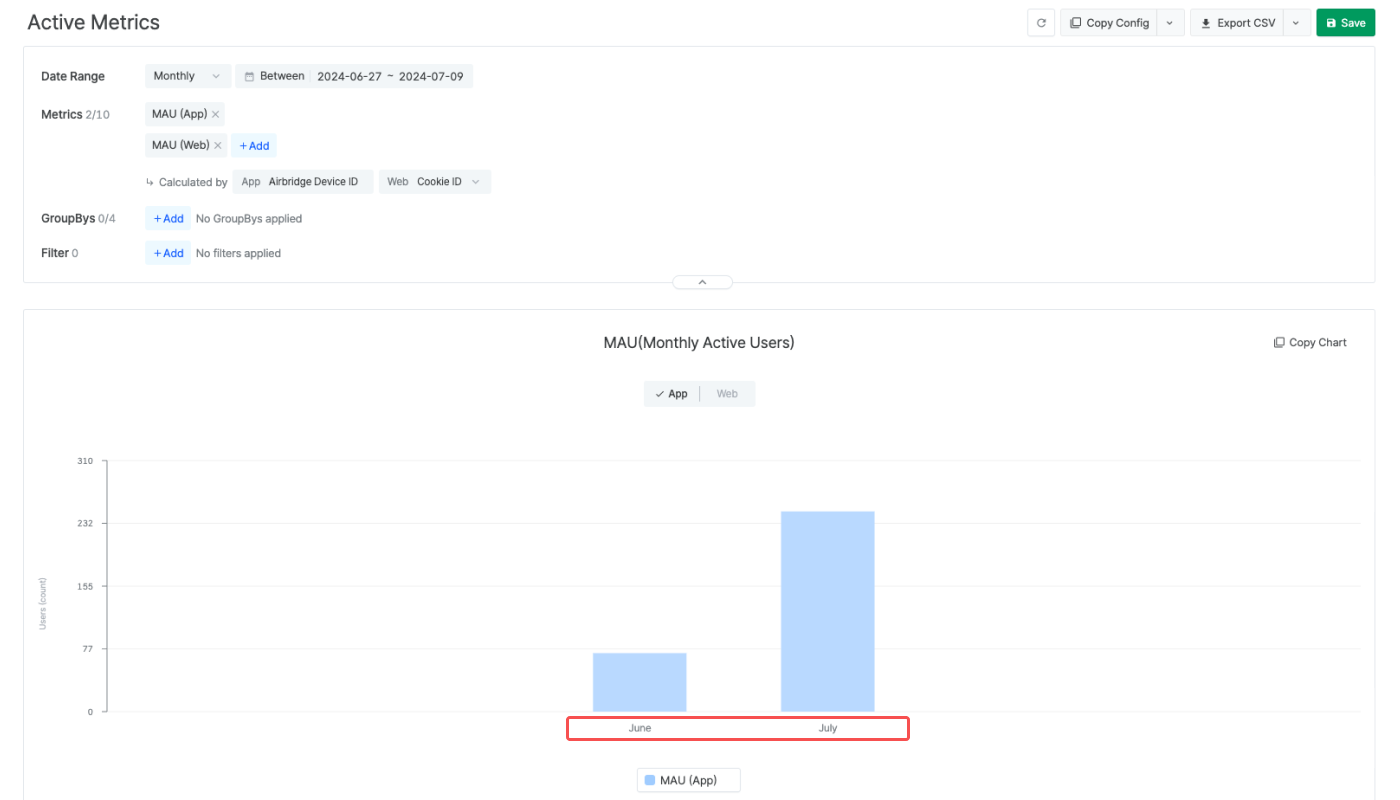
Granularity: Monthly
Date range: From 2024-06-27 (Thu) to 2024-07-09 (Tue)
The first range is displayed as June, which is from 2024-06-27 (Thu) to 2024-06-30 (Sun). The second range is displayed as July, which ais from 2024-07-01 (Mon) to 2024-07-09 (Tue).
Depending on the granularity settings, you can select the DAU, WAU, or MAU as a metric. For example, when setting the granularity to Monthly, you can select the MAU as a metric to create a report view.
Set the date range to create a report view that shows the metric data of the user who performed any event within a specific time period. Up to 175 days can be selected, including today.
Depending on the set granularity, the maximum date range you can configure differs.
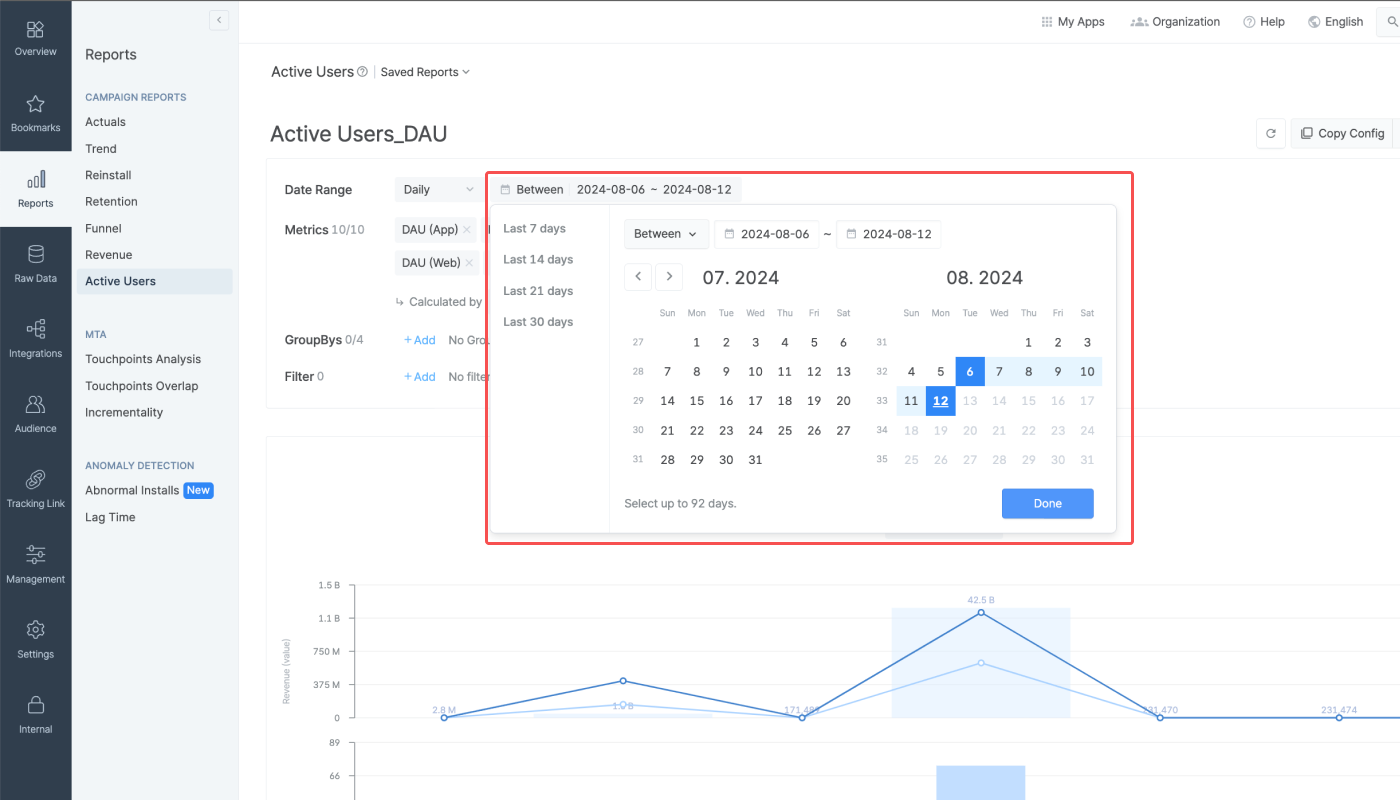
Daily: Select up to 31 days.
Weekly: Select up to 12 weeks.
Monthly: Select up to 3 months.
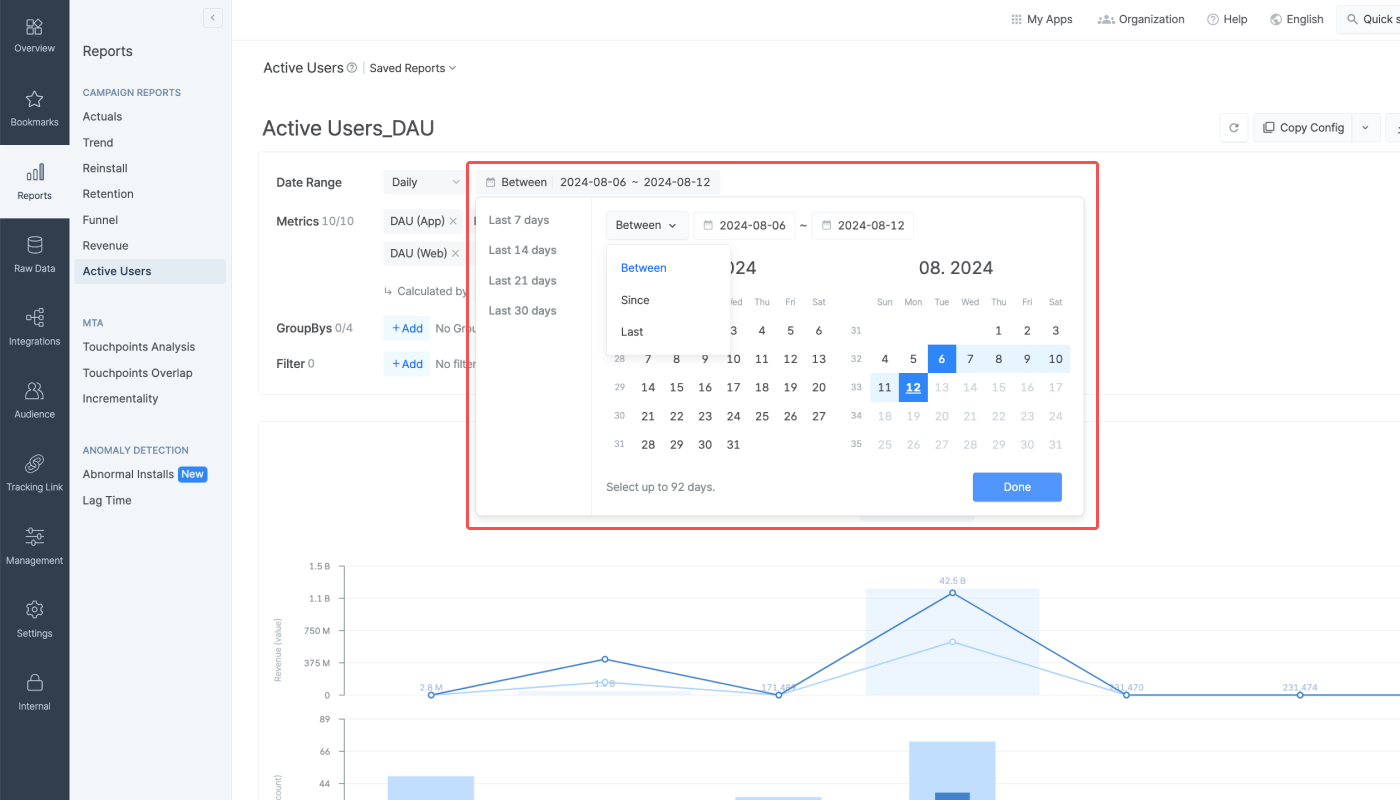
For more details about the date range settings, refer to the information below.
The date range can be set using the following conditions.
Condition | Date Range |
|---|---|
Between | From start date to end date |
Since | From start date to today |
Last | Last n days/weeks/months until yesterday |
When using “Last,” options such as “Include today,” “Include this month,” and “Offset” can be added.
For example, if you select Last 30 days and add Offset + 3 days, the date range will start 33 days before today and end 4 days before today.
The following metrics are available in the Active Users Report. Both app and web metrics can be visualized in the report at the same time.
Both app and web metrics are available in the Active Users Report. App metrics are suffixed with (App) and web metrics are suffixed with (Web).
The DAU, WAU, and MAU are available as a metric depending on the selected granularity. For example, if the granularity is set to Daily, DAU is available as a metric. If the granularity is set to Monthly, MAU is available as a metric.
Metrics | Description |
|---|---|
DAU, WAU, MAU | Number of unique users who performed at least 1 event during the set date range. Only 1 available depending on the set granularity. |
Paying Users | Number of users who performed revenue-related events (Order Cimplete, Subscribe, Ad Impression, Ad Click) |
Revenue | Sum of the revenue generated by revenue-related events (Order Cimplete, Subscribe, Ad Impression, Ad Click) |
ARPU | Average Revenue per Active User |
ARPPU | Average Revenue per Paying User |
Active Users (App) 미집계 유저 Users that are not aggregated as Active Users
The following users are not aggregated as Active Users, and are not included in the DAU, WAU, and MAU metric data.
Users who didn't launch the app
Users who deleted the app
For example, when the granularity is set to
Daily, the user who launched your app on January 1 is aggregated as an Active User and is included in the DAU. If this user does not launch the app on the next day and deletes the app, the user won't be included in the DAU of January 2.
The Calculated by selector allows you to use different identifiers for determining unique web users. The query result may vary depending on the selected identifier.
Device IDs, which are UUIDs, are used to determine unique users who performed app events.
In the Active Users Report, GAID is used for Android and IDFV is used for iOS.
When GAID or IDFV are not collected or unavailable, the Random Generated ID generated by the Airbridge SDK is used.
Cookie IDs or user IDs are used to determine unque users who performed web events. Cookie ID is a type of device IDs.
Cookie ID: Airbridge aggregates all users who entered the service regardless of whether the user logged in to your service or not
User ID: Airbridge aggregates unique users based on the login information of your service. The
user.externalUserIDattribute must be set in the Airbridge Web SDK to send User IDs to Airbridge. For more details, refer to the developer guide.
Attention
The Revenue (Web) data aggregated based on the unique users determined by User IDs in the Active Users Report may be different from the Revenue (Web) data in the Actuals Report and Trend Report. This is because the Active Users Report does not aggregate the revenue generated by users who are not identifiable by User IDs.
Attention
The GroupBy and filter settings apply to the charts and table as follows.
GroupBy settings: Applies to the table only
Filter settings: Applies to both the charts and table
GroupBys are used to split the metric data into groups. Up to 4 GroupBys can be selected. You can rearrange the order of the GroupBys in the table by dragging the GroupBy chips.
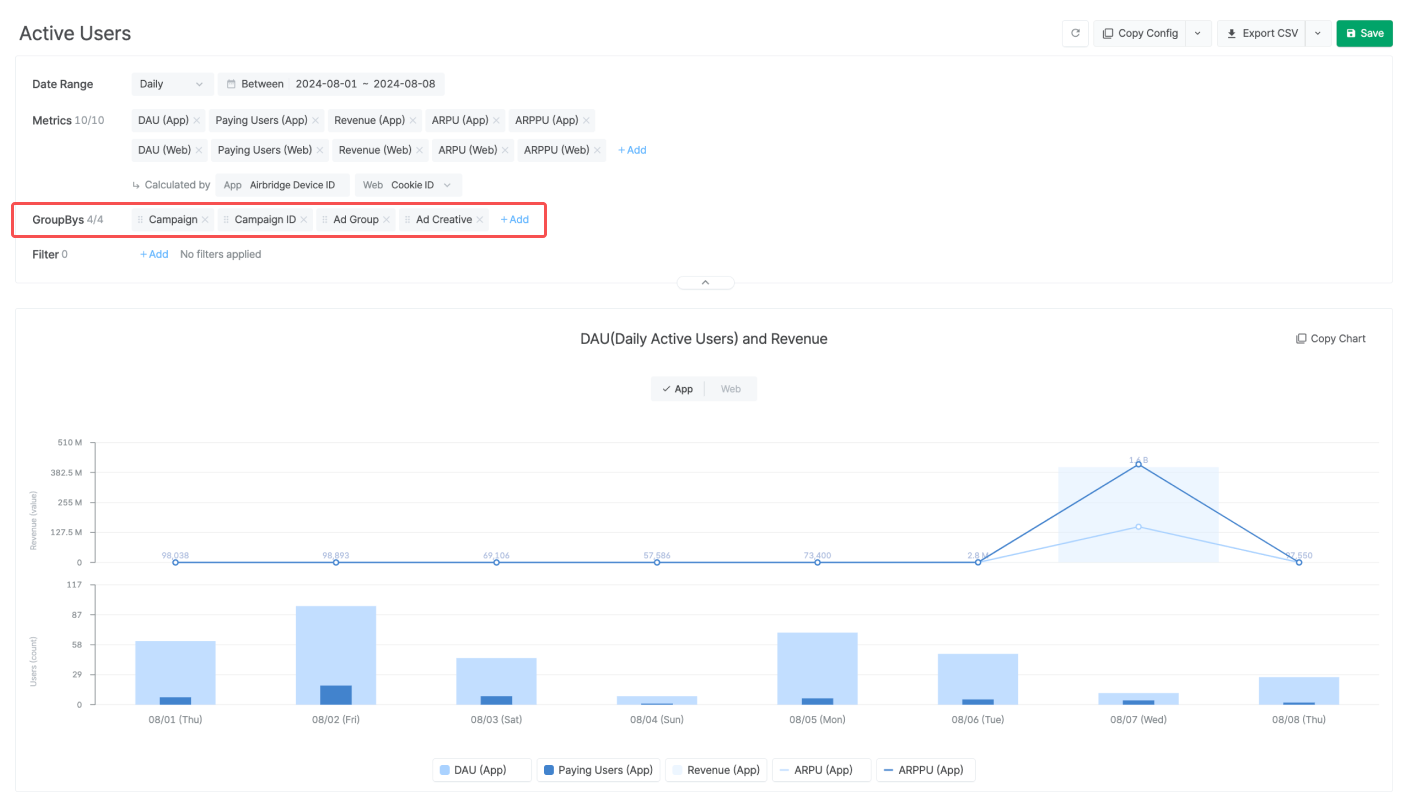
Filters can be configured to display specific data in the chart and table. To configure a filter, select the filter option, operator, and value.
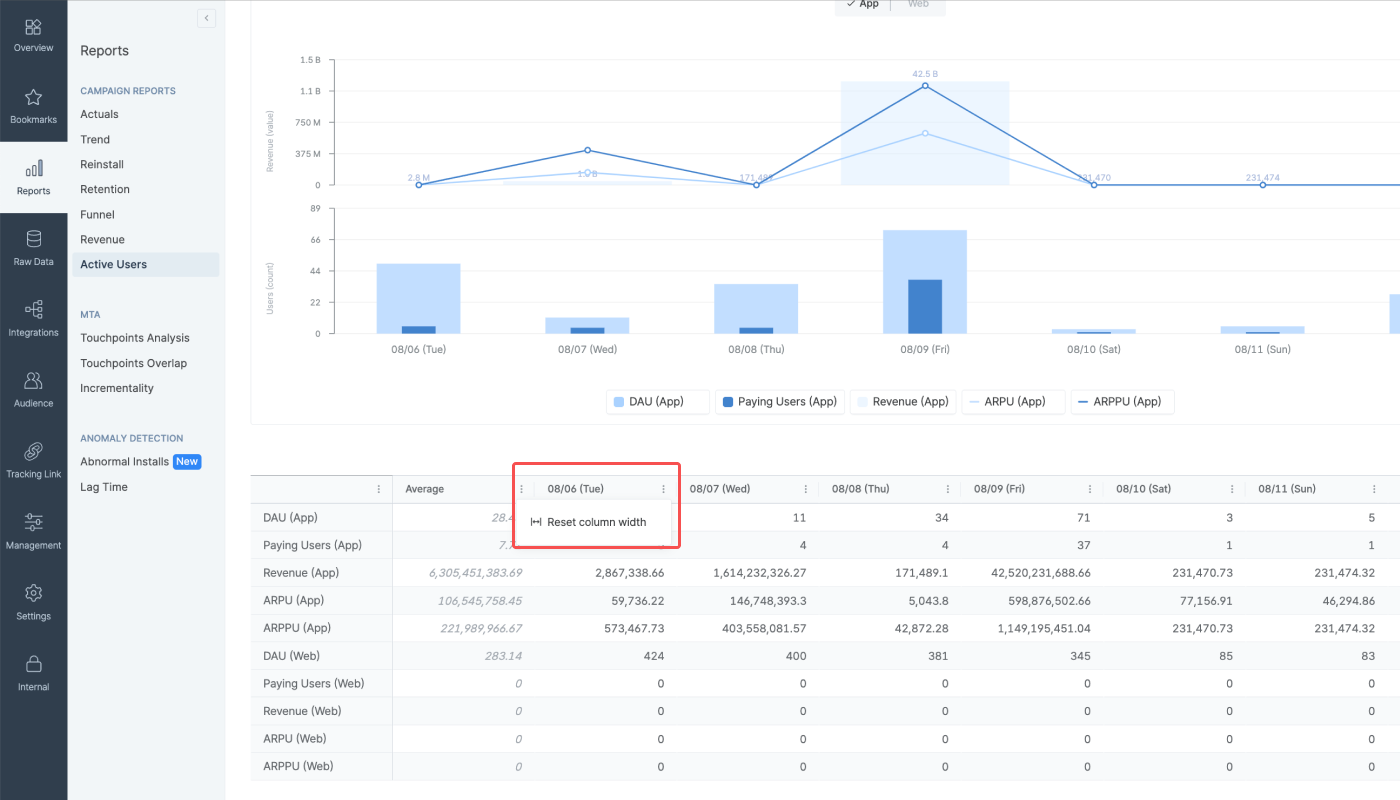
The Active Users Report visualizes the metric data at the chosen granularity in 2 charts and a table.
Note
Starting February 4, 2025, the Overview Dashboard, Actuals Report, Trend Report, Retention Report, Revenue Report, Active Users Report, and Audience Manager will only display events and metrics measurable using the collected data.
The Active Users Report provides a bar chart and a line chart to display different metrics. Hover over the chart to view the data points in numbers.
DAU, WAU, MAU, Paying Users, Revenue: Bar chart
ARPU, ARPPU: Line chart
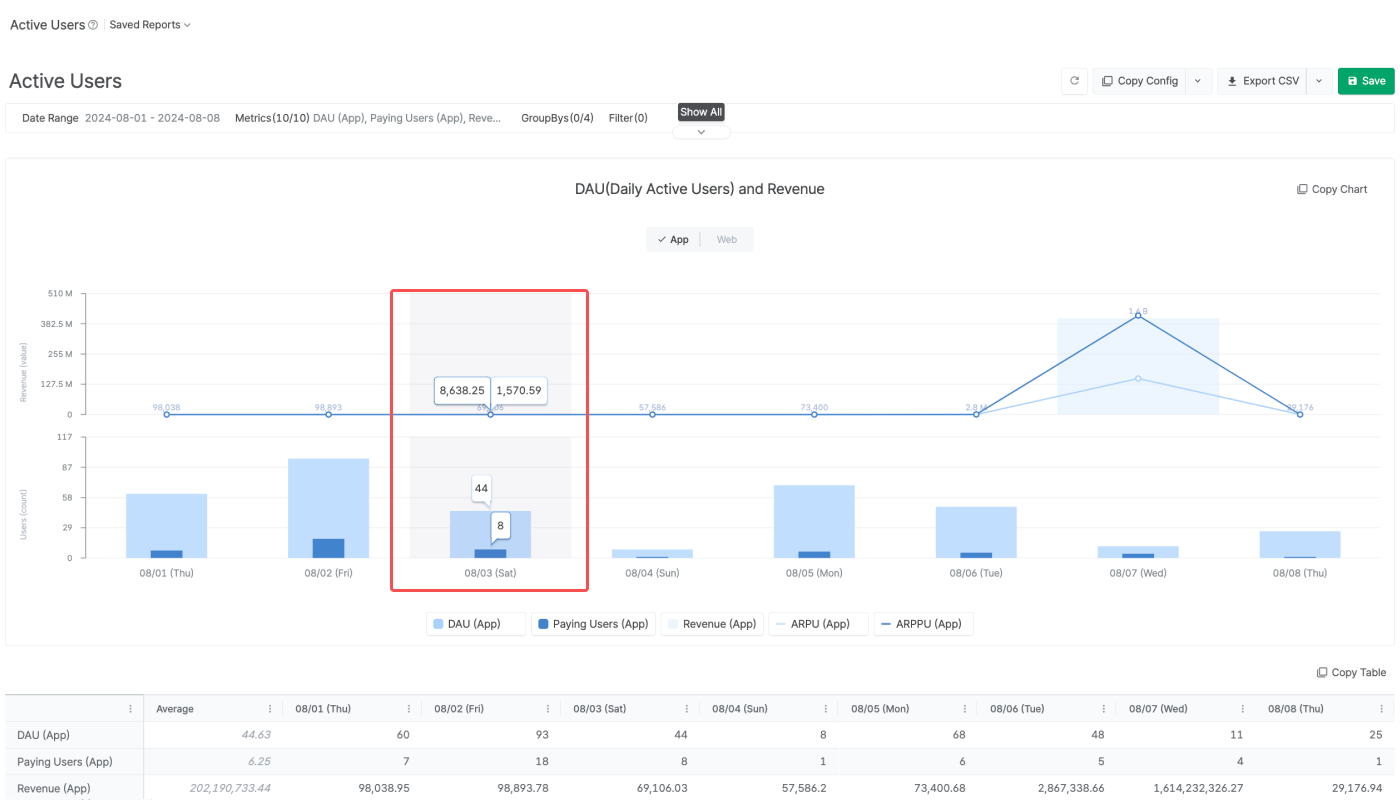
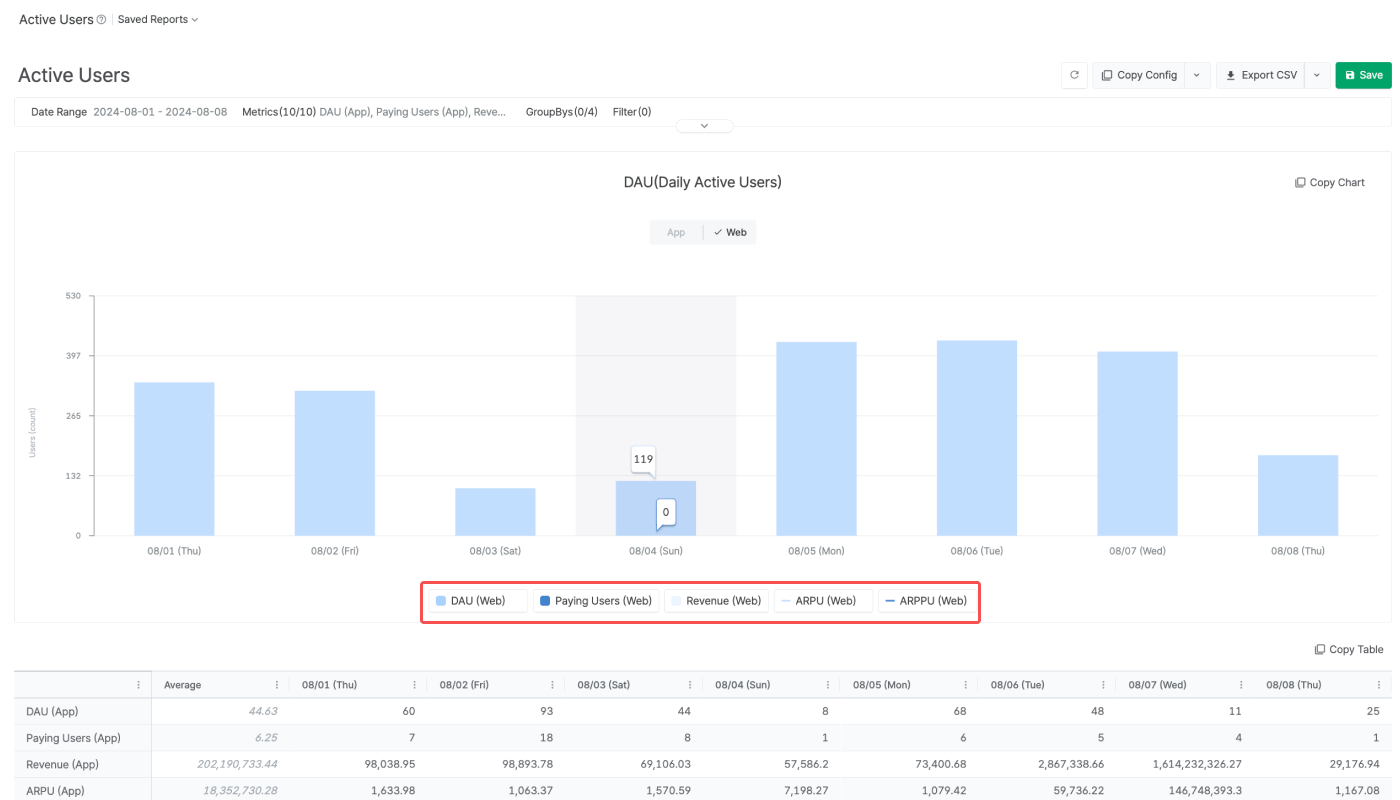
Click App or Web to view only 1 type of data. Click the metric items to hide or show specific items. The scale will be automatically adjusted when adding or removing certain metrics.
The table shows the metric data by the set granularity. Both App data and Web data are displayed. In the first column, the average figure of each metric is displayed.
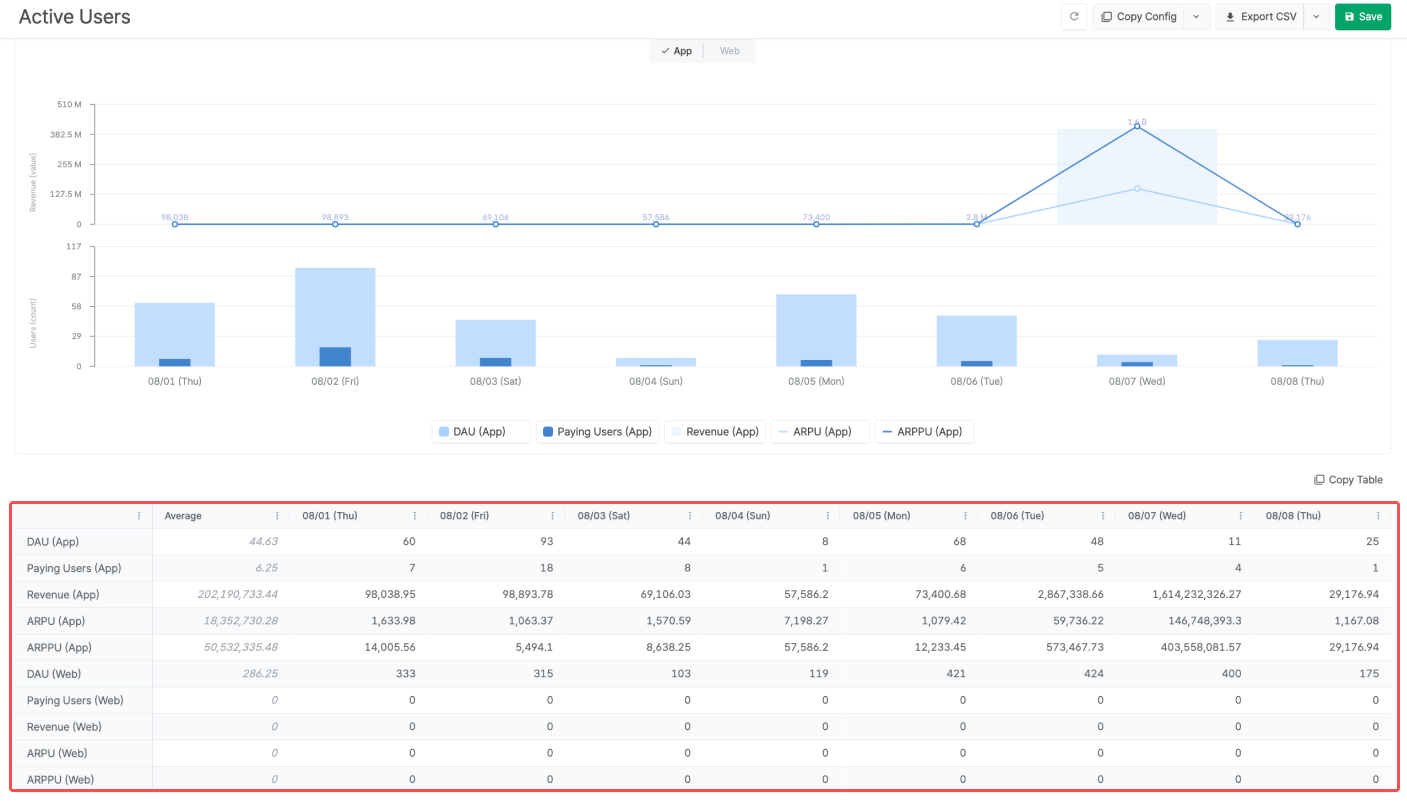
The width of the columns is adjustable. To set the column width to default settings, click the [vertical ellipsis] icon and click Reset column width.
Airbridge reports support various features, from saving reports to sharing them with others.
The table shows the general features supported by Airbridge reports. Some features are not available in certain reports.
Feature |
Description |
|---|---|
Refresh | Reload data with the existing report configuration. The time passed since the time the data was loaded appears next to the Refresh button or Copy Table button. |
Wide controls | Configure the report on a wider panel. |
Search | Search the report by keywords. |
Expand/Collapse | Expand or collapse the configuration box. |
Report naming | Name the report and save it for later use. |
Refer to the table below to learn how to share your report with others.
Feature |
Description |
User Guide |
|---|---|---|
Copy Config | Click Copy Config to share the report with other Airbridge users regardless of their app roles and access settings. | |
Share Report URL | The Report URL is the URL assigned to each Airbridge report. By sharing the report URL with other Airbridge users with the same access level as yours, you can share the same report view. | |
Grant App Access | Invite users to the Airbridge App and assign app roles. The data users can access depends on their app roles. | |
Copy Table | Click Copy Table and paste the table into a spreadsheet or a messenger. | |
Export CSV | Export the report as a CSV file or a Google Spreadsheet file. |
The table below outlines the features and limitations of the Active Users Report.
Supported features and limitations |
Description |
|---|---|
No. of metrics configured | 10 |
No. of GroupBys configured | 4 |
Self-serve Metrics, Calculated Metrics, Custom GroupBys | Not supported |
Timezone | The configured Airbridge App timezone |
Currency | The configured Airbridge App standard currency |
Data visualized in | Tables, charts |
Data refresh cycle | 1 hour |
Aggregated data | App event data, web event data |
Custom events | Not supported |
Data available of | 6 months (From D-174 to D-0) |
Maximum date range configurable for a single report view | 90 days |
このページは役に立ちましたか?