> ## Documentation Index
> Fetch the complete documentation index at: https://help.airbridge.io/llms.txt
> Use this file to discover all available pages before exploring further.
# Calculation Method Applied in the Retention Report
Understand how the number of retained users and the retention rate are calculated in the Retention Report.
## **Calculation method applied for top row and sub-row metric data**
Learn about the calculation methods applied for the number of retained users and the retention rate that is displayed in the top rows and sub-rows.
### **Number of Retained Users**
The number of retained users is the number of users who performed the Return Event after performing the Start Event. The number of retained users displayed in the sub-rows and top rows is calculated as follows.
* In the sub-rows: The sum of users who performed the Start Event during the set time range of the sub-row and performed a Return Event afterward.
* In the top rows: The sum of unique users who performed the Return Event in the sub-rows. The number of retained users displayed in the top row may be less than or equal to the sum of the number of retained users displayed in the sub-rows.
Let’s say you are creating a report view on 2024-04-04 using the configurations below.
* Granularity and Date Range: Daily, From 2024-03-31 to 2024-04-04
* Start Event: Install (App)
* Return Event: Any Event
* Measurement Option: General
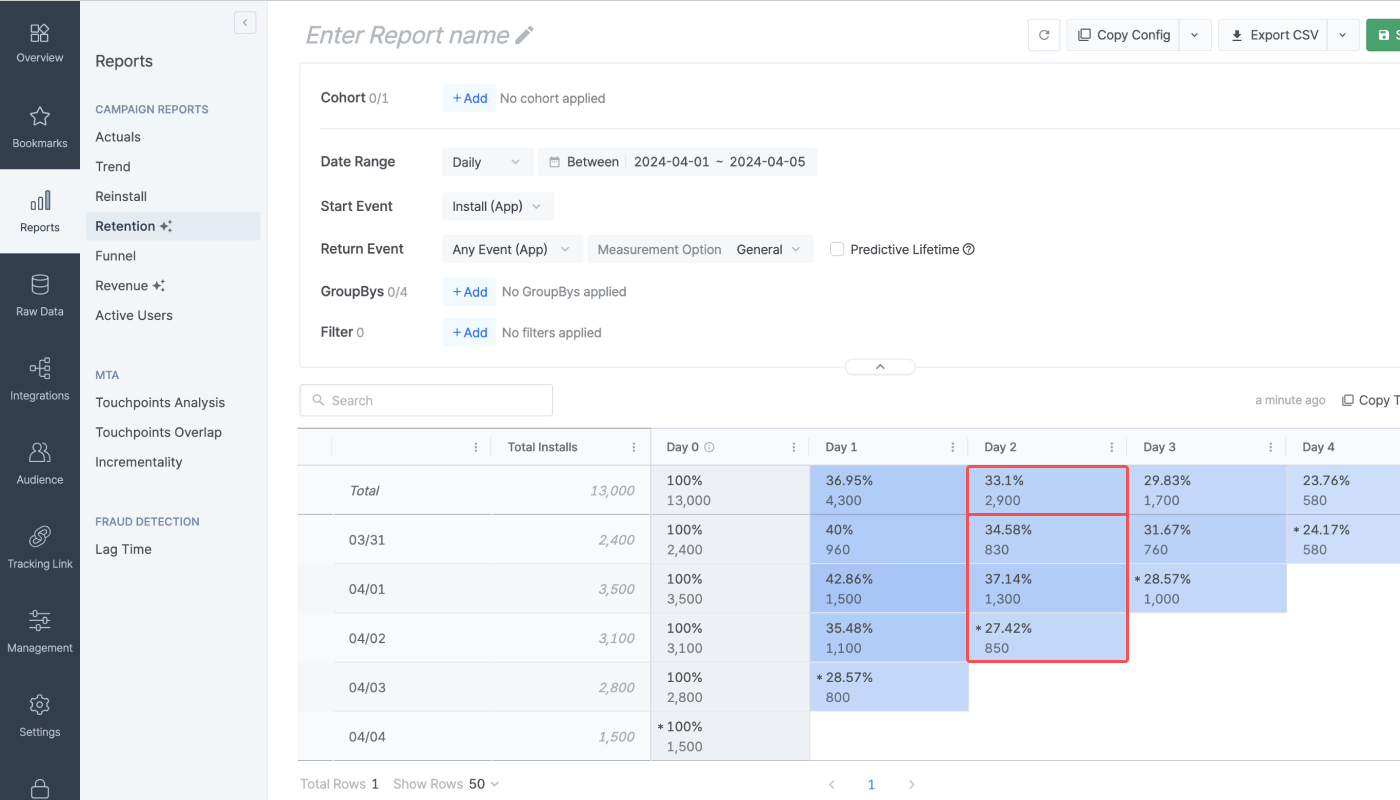
Your Retention Report may look like the following image.
In this case, the number of retained users for Day 2 is calculated as follows.
* Sub-rows
* Retained users for Day 2 of 2024-03-31: The number of users who performed the Start Event on 2024-03-31 and performed the Return Event on Day 2, which is 2024-04-02.
* Retained users for Day 2 of 2024-04-01: The number of users who performed the Start Event on 2024-04-01 and performed the Return Event on Day 2, which is 2024-04-03.
* Retained users for Day 2 of 2024-04-02: The number of users who performed the Start Event on 2024-04-02 and performed the Return Event on Day 2, which is today, 2024-04-04.
* Top row: The sum of the number of retained unique users in the sub-rows. The number of retained users displayed in the top row may be smaller than the sum of the number of retained users displayed in the sub-rows.
* Retained users for Day 2 of 2023-04-03 and 2023-04-04 are not provided in the report because today is 202-04-04, and Day 2 has not come yet.
### **Retention Rate**
The retention rate is the percentage of users who performed the Return Event after performing the Start Event. The retention rate displayed in the sub-rows and top rows is calculated as follows.
* In the sub-rows = (The number of retained users in the sub-row) / (The number of Start Events collected during the set date range of the sub-row) \* 100
* In the top rows = The sum of the \{(The retention rate of a sub-row) \* (Weighted value of the number of users who performed the Start Event during the set date range of the sub-row)}
Let’s say you are creating a report view on 2024-04-04 using the configurations below.
* Granularity and Date Range: Daily, 2024-03-31 \~ 2024-04-04
* Start Event: Install (App)
* Return Event: Any Event
* Measurement Option: General
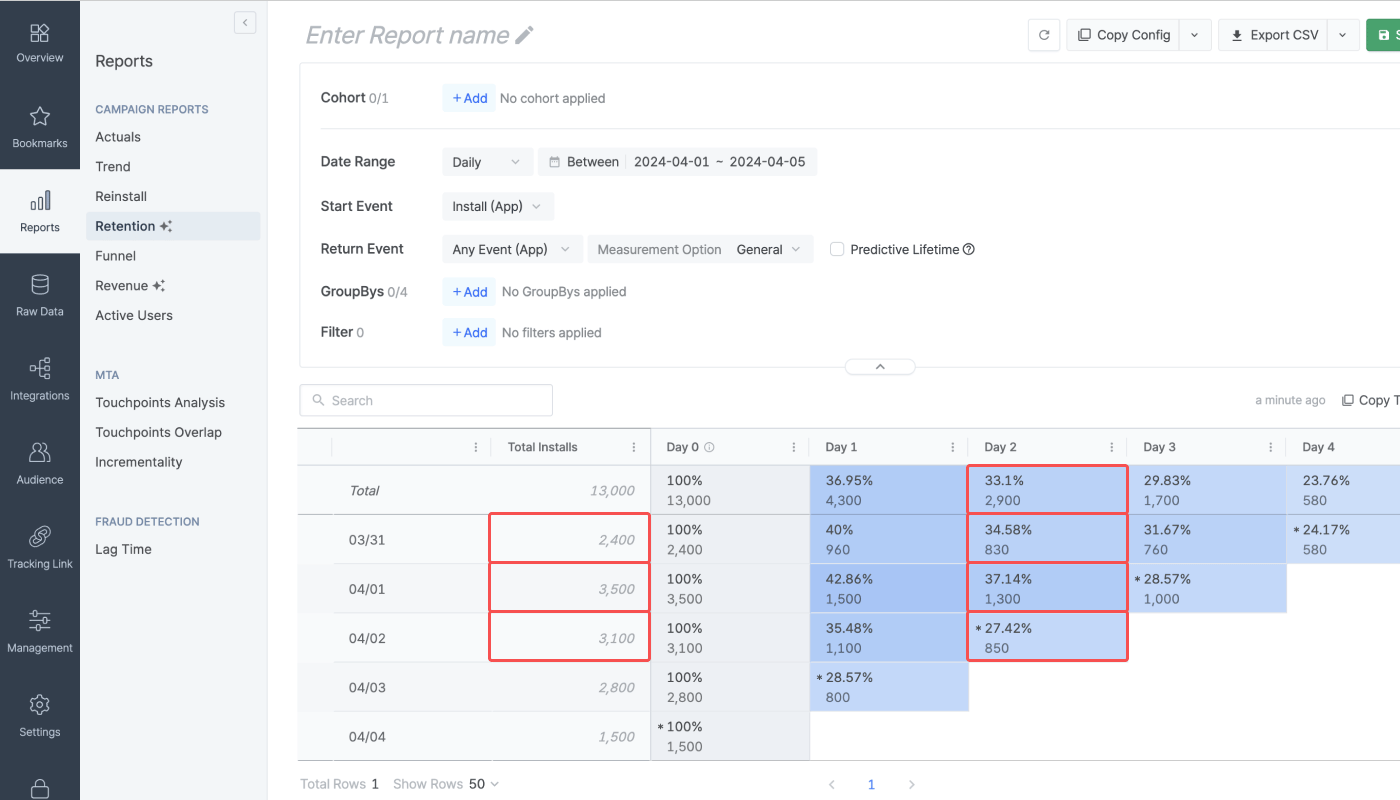
Your Retention Report may look like the following image.
In this case, the retention rate in the top row cell of Day 2 is 33.1% and has been calculated as follows.
1. The weighted value of the total installs for each sub-row is calculated.
* The weighted value of the total installs on \[2024-03-31] = 2,400 / (2,400 + 3,500 + 3,100) = 0.267
* The weighted value of the total installs on \[2024-04-01] = 3,500 / (2,400 + 3,500 + 3,100) = 0.389
* The weighted value of the total installs on \[2024-04-02] = 3,100 / (2,400 + 3,500 + 3,100) = 0.344
2. The retention rate is multiplied by the weighted value calculated in step 1.
* (Retention rate for Day 2 of 2024-03-31) \* (Weighted value of 2023-03-31) = 0.0923
* (Retention rate for Day 2 of 2024-04-01) \* (Weighted value of 2023-04-01) = 0.1444
* (Retention rate for Day 2 of 2024-04-02) \* (Weighted value of 2023-04-02) = 0.0943
3. All values calculated in step 2 are summed and multiplied by 100.
* (0.0923 + 0.1444 + 0.0943) \* 100 = 33.1
**Attention**
Note that if you select minutely or hourly from the granularity drop-down menu in the configuration box, no sub-rows are provided in the report. The aggregation method for the the number of retained users and the retention rate applies the same.
 In this case, the number of retained users for Day 2 is calculated as follows.
* Sub-rows
* Retained users for Day 2 of 2024-03-31: The number of users who performed the Start Event on 2024-03-31 and performed the Return Event on Day 2, which is 2024-04-02.
* Retained users for Day 2 of 2024-04-01: The number of users who performed the Start Event on 2024-04-01 and performed the Return Event on Day 2, which is 2024-04-03.
* Retained users for Day 2 of 2024-04-02: The number of users who performed the Start Event on 2024-04-02 and performed the Return Event on Day 2, which is today, 2024-04-04.
* Top row: The sum of the number of retained unique users in the sub-rows. The number of retained users displayed in the top row may be smaller than the sum of the number of retained users displayed in the sub-rows.
* Retained users for Day 2 of 2023-04-03 and 2023-04-04 are not provided in the report because today is 202-04-04, and Day 2 has not come yet.
In this case, the number of retained users for Day 2 is calculated as follows.
* Sub-rows
* Retained users for Day 2 of 2024-03-31: The number of users who performed the Start Event on 2024-03-31 and performed the Return Event on Day 2, which is 2024-04-02.
* Retained users for Day 2 of 2024-04-01: The number of users who performed the Start Event on 2024-04-01 and performed the Return Event on Day 2, which is 2024-04-03.
* Retained users for Day 2 of 2024-04-02: The number of users who performed the Start Event on 2024-04-02 and performed the Return Event on Day 2, which is today, 2024-04-04.
* Top row: The sum of the number of retained unique users in the sub-rows. The number of retained users displayed in the top row may be smaller than the sum of the number of retained users displayed in the sub-rows.
* Retained users for Day 2 of 2023-04-03 and 2023-04-04 are not provided in the report because today is 202-04-04, and Day 2 has not come yet.
 In this case, the retention rate in the top row cell of Day 2 is 33.1% and has been calculated as follows.
1. The weighted value of the total installs for each sub-row is calculated.
* The weighted value of the total installs on \[2024-03-31] = 2,400 / (2,400 + 3,500 + 3,100) = 0.267
* The weighted value of the total installs on \[2024-04-01] = 3,500 / (2,400 + 3,500 + 3,100) = 0.389
* The weighted value of the total installs on \[2024-04-02] = 3,100 / (2,400 + 3,500 + 3,100) = 0.344
2. The retention rate is multiplied by the weighted value calculated in step 1.
* (Retention rate for Day 2 of 2024-03-31) \* (Weighted value of 2023-03-31) = 0.0923
* (Retention rate for Day 2 of 2024-04-01) \* (Weighted value of 2023-04-01) = 0.1444
* (Retention rate for Day 2 of 2024-04-02) \* (Weighted value of 2023-04-02) = 0.0943
3. All values calculated in step 2 are summed and multiplied by 100.
* (0.0923 + 0.1444 + 0.0943) \* 100 = 33.1
In this case, the retention rate in the top row cell of Day 2 is 33.1% and has been calculated as follows.
1. The weighted value of the total installs for each sub-row is calculated.
* The weighted value of the total installs on \[2024-03-31] = 2,400 / (2,400 + 3,500 + 3,100) = 0.267
* The weighted value of the total installs on \[2024-04-01] = 3,500 / (2,400 + 3,500 + 3,100) = 0.389
* The weighted value of the total installs on \[2024-04-02] = 3,100 / (2,400 + 3,500 + 3,100) = 0.344
2. The retention rate is multiplied by the weighted value calculated in step 1.
* (Retention rate for Day 2 of 2024-03-31) \* (Weighted value of 2023-03-31) = 0.0923
* (Retention rate for Day 2 of 2024-04-01) \* (Weighted value of 2023-04-01) = 0.1444
* (Retention rate for Day 2 of 2024-04-02) \* (Weighted value of 2023-04-02) = 0.0943
3. All values calculated in step 2 are summed and multiplied by 100.
* (0.0923 + 0.1444 + 0.0943) \* 100 = 33.1