> ## Documentation Index
> Fetch the complete documentation index at: https://help.airbridge.io/llms.txt
> Use this file to discover all available pages before exploring further.
# Lag Time Report
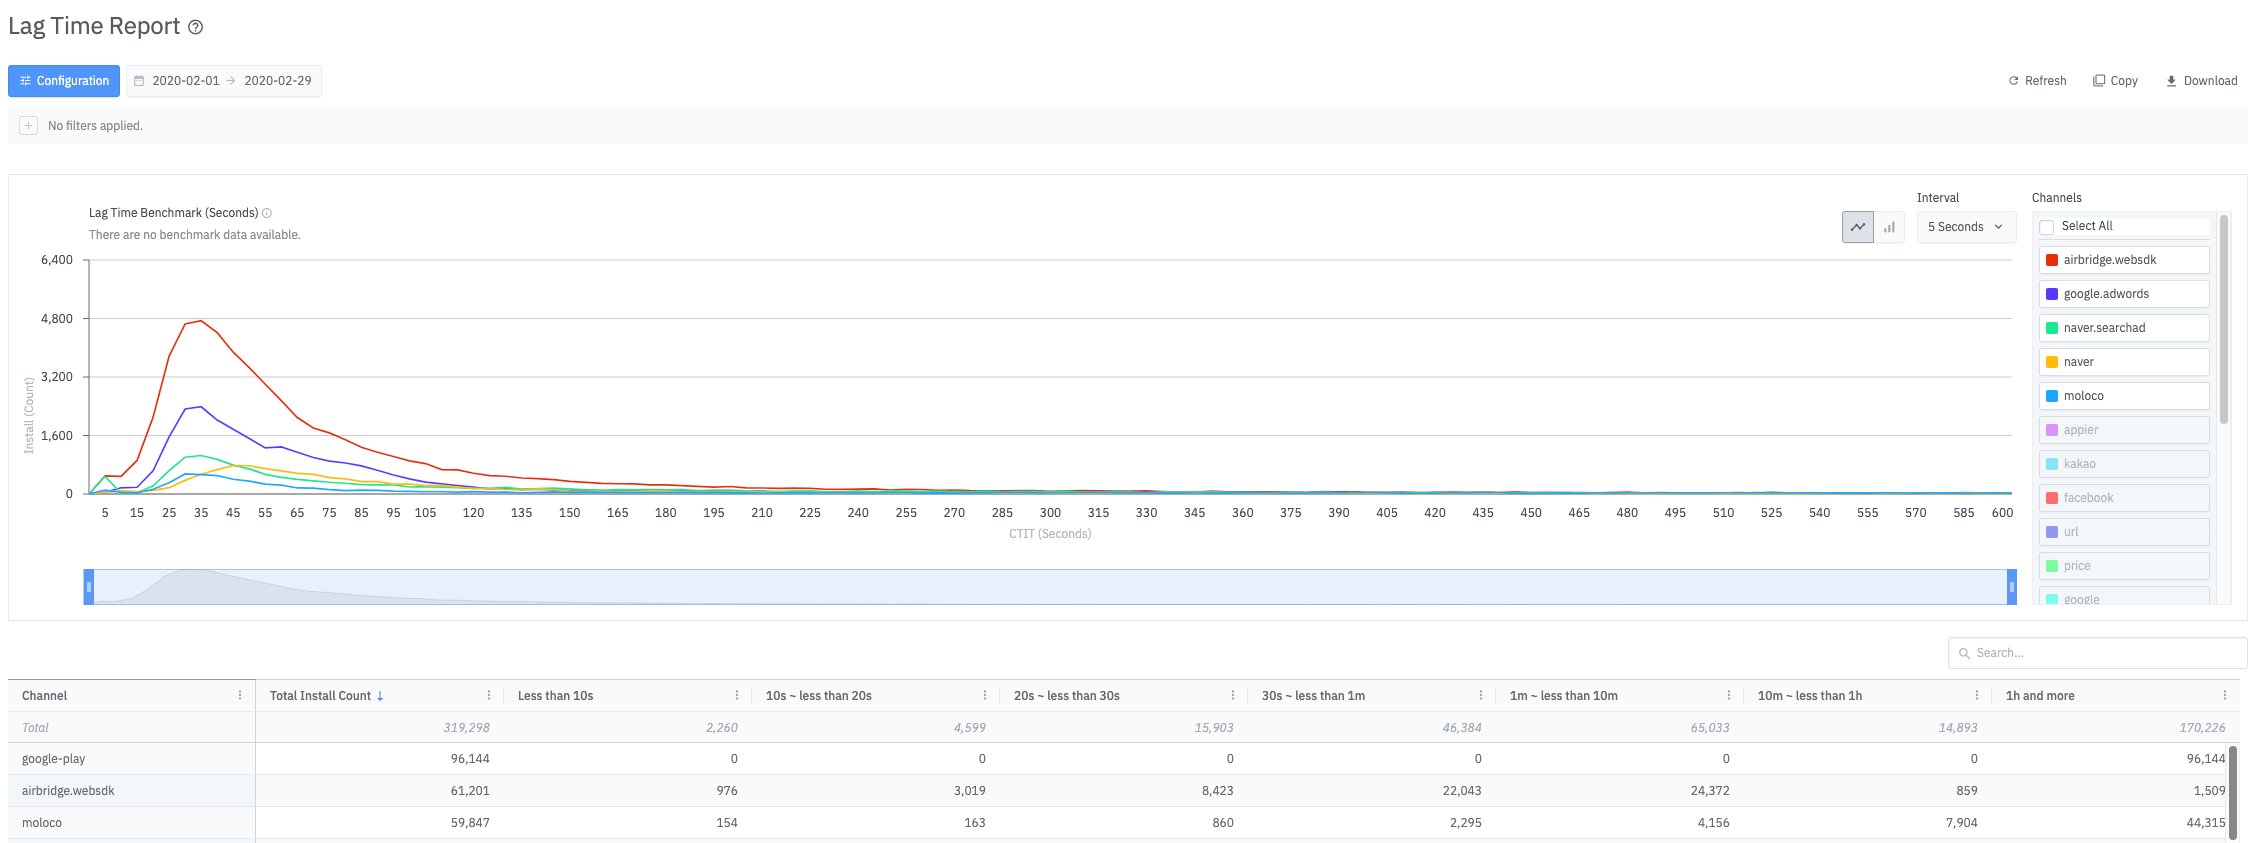
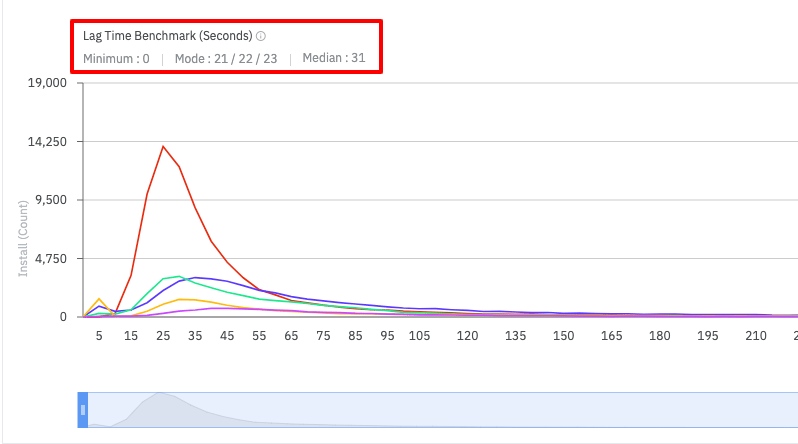
Click-To-Install-Time (CTIT) refers to the time from ad click to install. In the Lag Time Report, the CTIT distribution is visualized in a chart and table. Keep an eye out for potential ad fraud if you notice any unusual changes in the chart.
Navigate to **\[Reports]>\[Lag Time Report]** to open the Lag Time Report.
## Configuring a Report View
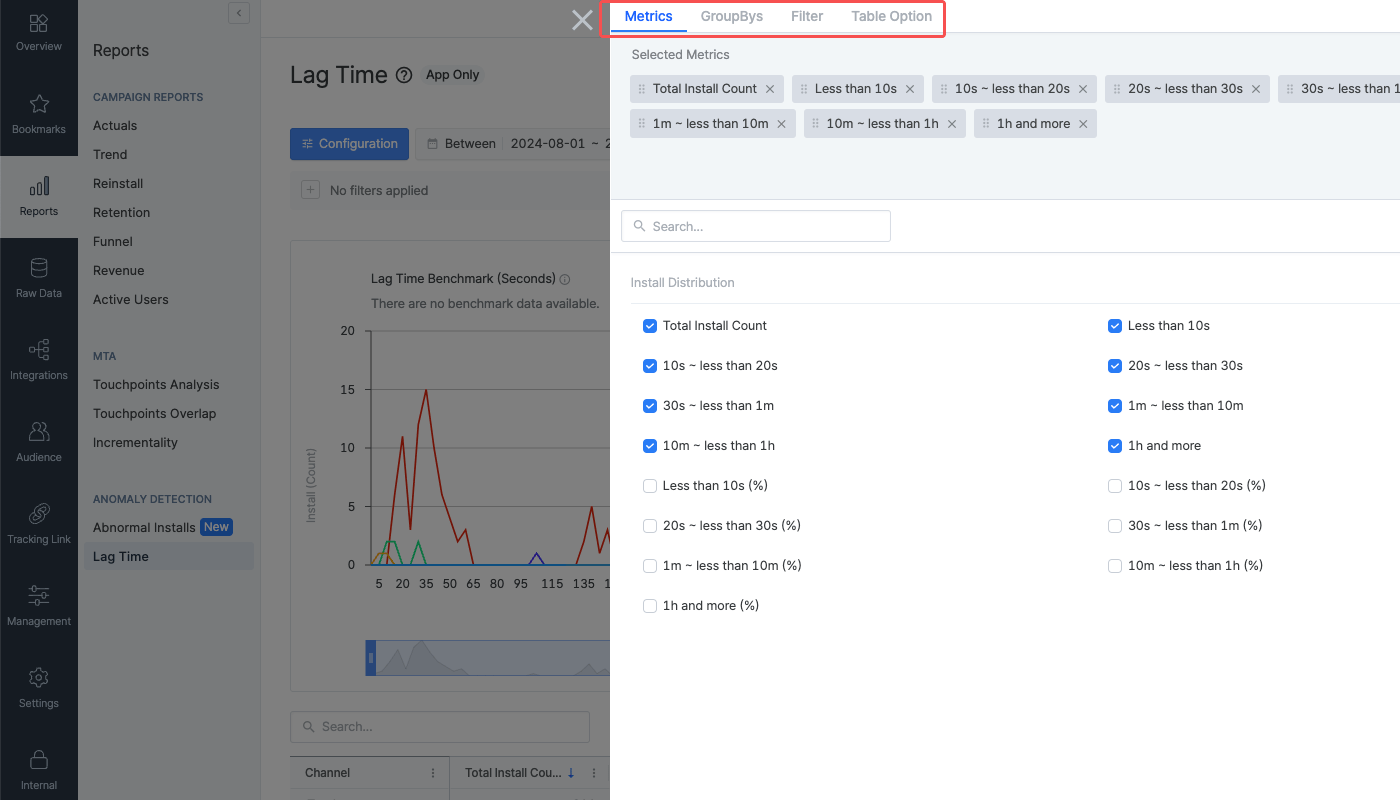
Click **Configuration** to open the side panel. The configuration settings apply only to the table. The chart displays the CTIT by channel and is not affected by the configuration settings.
The configured metric, GroupBy, filter settings in the side panel apply to the table. In the **\[Table Option]** tab, you can configure the max. number of items per page, sort criteria, etc.
## Understanding the Lag Time Report
The Lag Time Report provides data in a chart and a table. The configuration settings apply only to the table.
### Chart
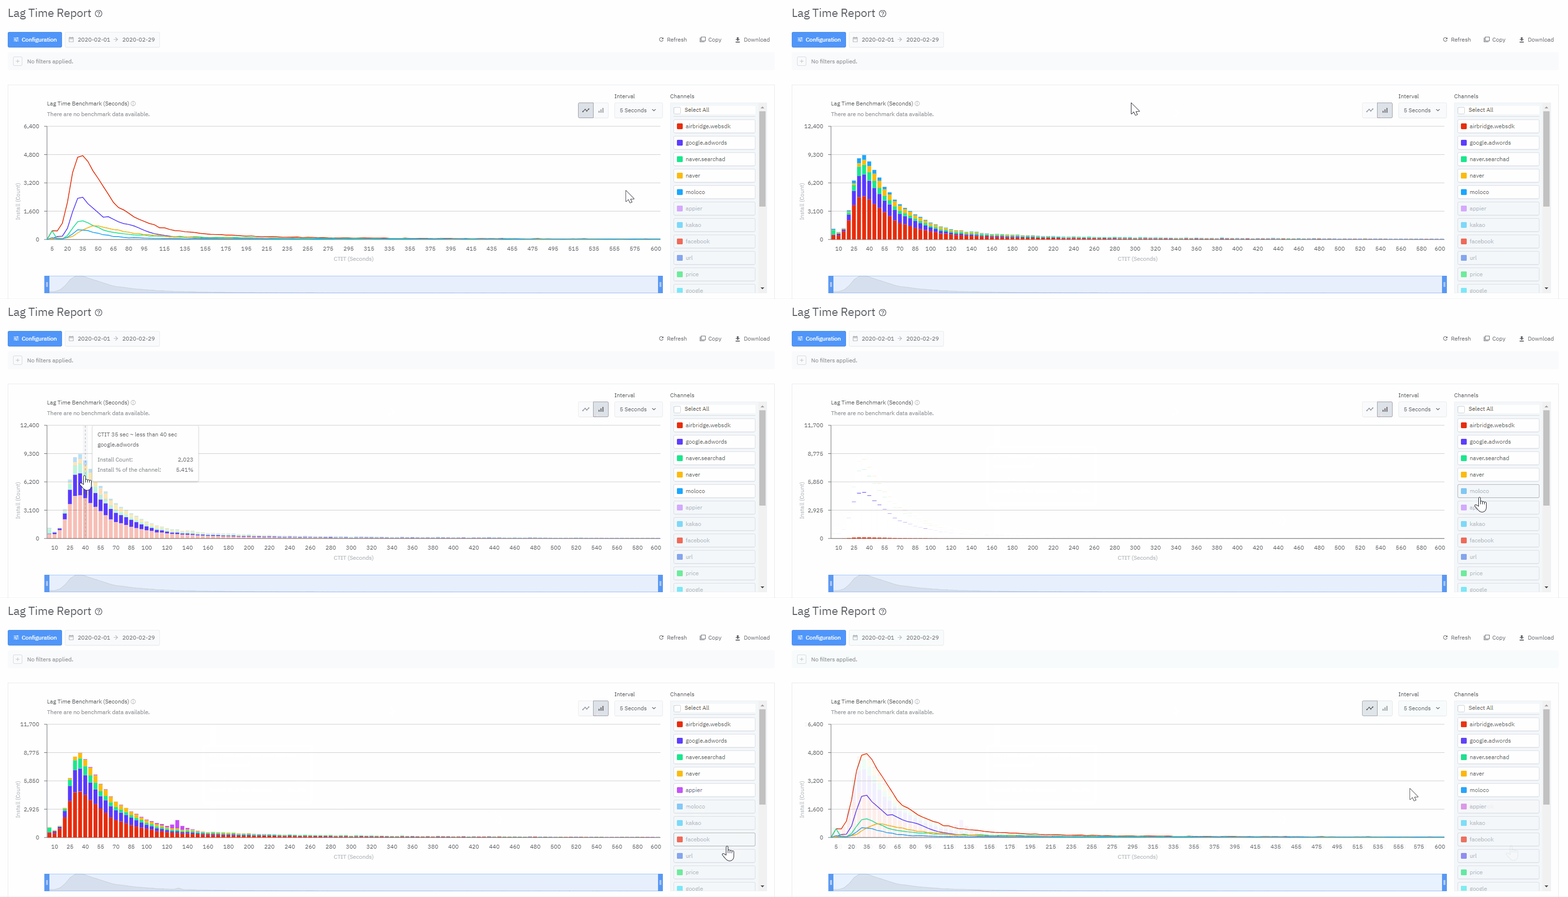
The chart shows the CTIT distribution by channel and is not affected by the configuration settings. Hover over the trend line of a channel to view its install count and percentage of total installs. Click on the items in the legend on the left of the chart to show or hide the trend lines in the chart.
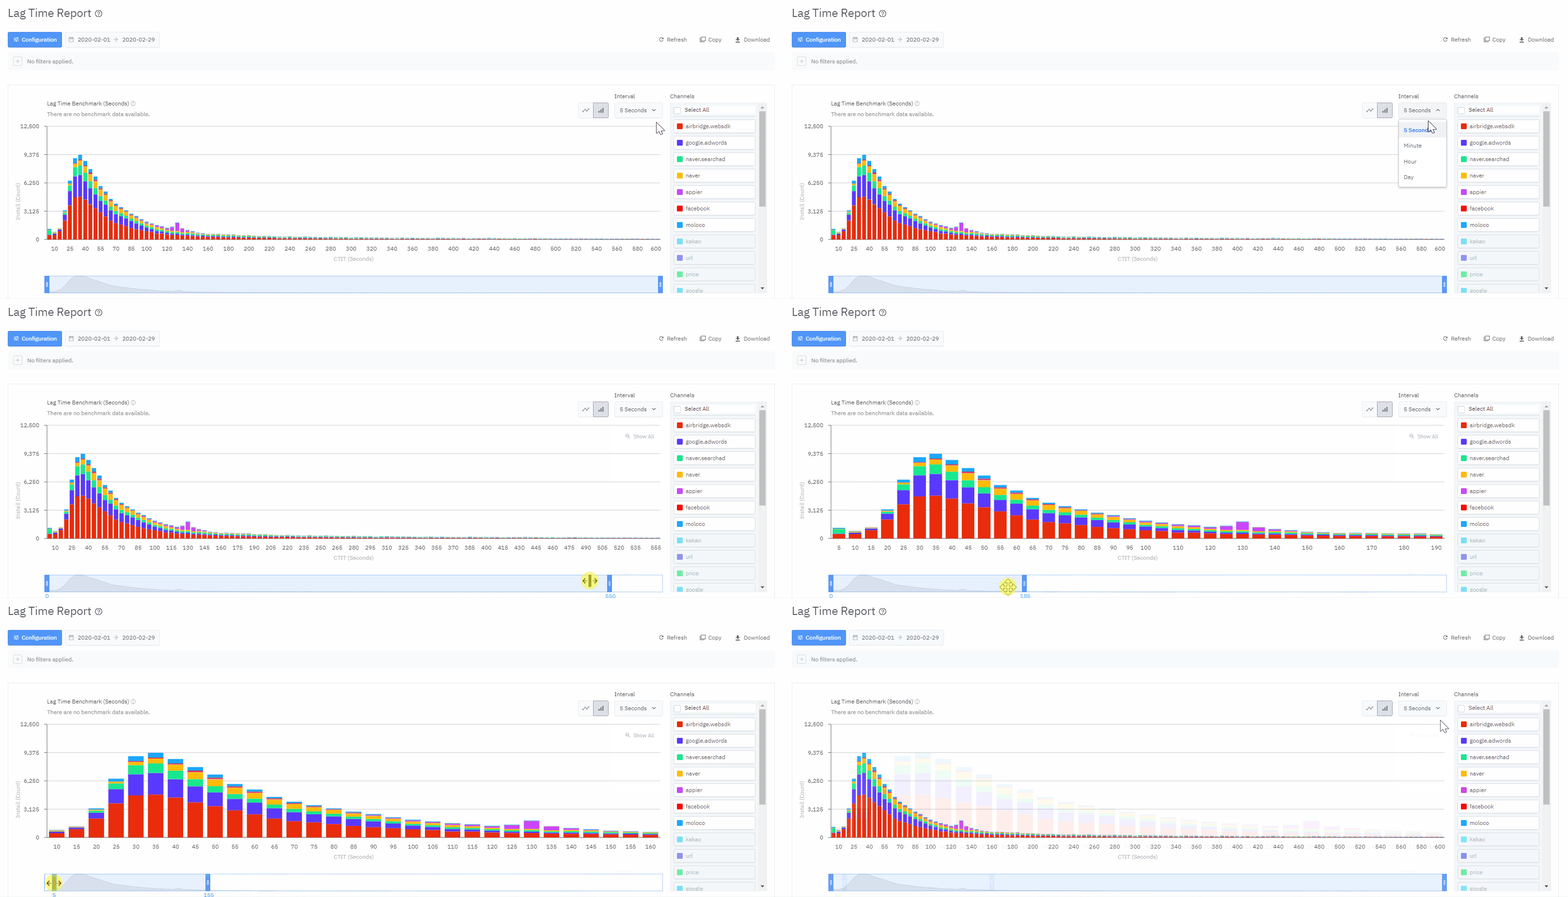
In the **Interval** selector, you can configure the duration of a range that is visualized in the chart. The options include 5 seconds, 1 minute, 1 hour, and 1 day.
If you want to examine the CTIT data more granularly, select a shorter duration from the **Interval** selector. You can also use the range controller to visualize a specific section of data in the chart.
### Table
The configured metric, GroupBy, filter settings apply to the table only.
### Using the Lag Time Benchmark Data
The benchmark CTIT is the time it took for users from clicking the app download button in the Google Play Store to launching the app for the first time. Negative CTIT values that are unknown or negative are excluded from the benchmark CTIT calculation.
### Supported features
Refer to the table below to learn how to share your report with others.
| Feature | Description | User Guide |
| --------------------------------------------------------------------------- | -------------------------------------------------------------------------------------------------------------------------------------------------------------------------------------------------------------------------- | -------------------------------------------------------------------------------------------------------------------------------------------------------------- |
| Copy Config | Click **Copy Config** to share the report with other Airbridge users regardless of their app roles and access settings. | - [Copy Config](/en/guides/share-airbridge-reports#using-copy-config) |
| Grant App Access | Invite users to the Airbridge App and assign app roles. The data users can access depends on their app roles. Users invited to the Airbridge App can access other features. Invite users after careful consideration. | - [Grant App access](/en/guides/share-airbridge-reports#granting-app-access-to-airbridge-users) - [Airbridge User Management](/en/guides/user-management) |
| Copy Table | Click **Copy Table** and paste the table into a spreadsheet or a messenger. | - [Copy Table](/en/guides/share-airbridge-reports#using-copy-table-and-copy-chart) |
## Attention
The table below outlines the features and limitations of the Lag Time Report.
###### Report Configuration
| Supported features and limitations | Description |
| ------------------------------------------------------------------------------------------------------ | ------------------------------------------------------------------------------- |
| No. of GroupBys that can be configured | 4 |
| Timezone | Follows the configured Airbridge App timezone |
###### Data Provision
| Supported features and limitations | Description |
| ------------------------------------------------------------------------------------------------------ | ------------------------------------------------------------------------------- |
| Data visualized in | Table, chart |
| Data refresh cycle | Real-time |
| Aggregated data | App event data |
| Maximum no. of rows in the Airbridge dashboard | 10,000 rows |
| Maximum no. of rows in the CSV file | 10,000 rows |
###### Date range and Data Retention
| Supported features and limitations | Description |
| ------------------------------------------------------------------------------------------------------ | ------------------------------------------------------------------------------- |
| Data available of | D-0 \~ D-365 |
| Maximum date range configurable for a single report view | 45 days |
| Data retention time | 365 days |
 The configured metric, GroupBy, filter settings in the side panel apply to the table. In the **\[Table Option]** tab, you can configure the max. number of items per page, sort criteria, etc.
 ## Understanding the Lag Time Report
The Lag Time Report provides data in a chart and a table. The configuration settings apply only to the table.
### Chart
The chart shows the CTIT distribution by channel and is not affected by the configuration settings. Hover over the trend line of a channel to view its install count and percentage of total installs. Click on the items in the legend on the left of the chart to show or hide the trend lines in the chart.
## Understanding the Lag Time Report
The Lag Time Report provides data in a chart and a table. The configuration settings apply only to the table.
### Chart
The chart shows the CTIT distribution by channel and is not affected by the configuration settings. Hover over the trend line of a channel to view its install count and percentage of total installs. Click on the items in the legend on the left of the chart to show or hide the trend lines in the chart.
 In the **Interval** selector, you can configure the duration of a range that is visualized in the chart. The options include 5 seconds, 1 minute, 1 hour, and 1 day.
If you want to examine the CTIT data more granularly, select a shorter duration from the **Interval** selector. You can also use the range controller to visualize a specific section of data in the chart.
In the **Interval** selector, you can configure the duration of a range that is visualized in the chart. The options include 5 seconds, 1 minute, 1 hour, and 1 day.
If you want to examine the CTIT data more granularly, select a shorter duration from the **Interval** selector. You can also use the range controller to visualize a specific section of data in the chart.
 ### Table
The configured metric, GroupBy, filter settings apply to the table only.
### Using the Lag Time Benchmark Data
The benchmark CTIT is the time it took for users from clicking the app download button in the Google Play Store to launching the app for the first time. Negative CTIT values that are unknown or negative are excluded from the benchmark CTIT calculation.
### Table
The configured metric, GroupBy, filter settings apply to the table only.
### Using the Lag Time Benchmark Data
The benchmark CTIT is the time it took for users from clicking the app download button in the Google Play Store to launching the app for the first time. Negative CTIT values that are unknown or negative are excluded from the benchmark CTIT calculation.
 ### Supported features