> ## Documentation Index
> Fetch the complete documentation index at: https://help.airbridge.io/llms.txt
> Use this file to discover all available pages before exploring further.
# Creating a New Metric
With Airbridge, you can upload data to Airbridge and create your own custom metrics to monitor the health and performance of your service.
## Creating Metrics through Data Uploads
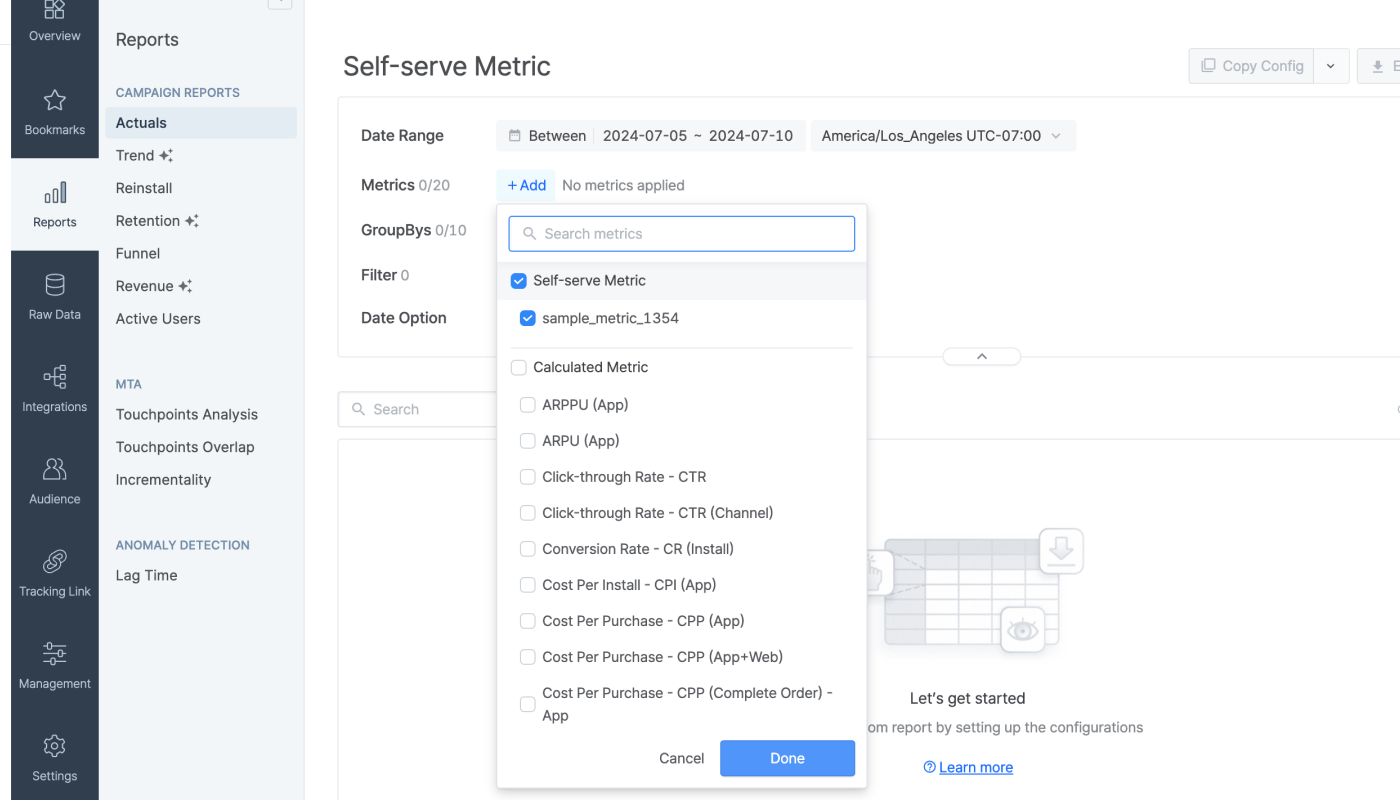
You can upload data to Airbridge that is not collected through the Airbridge SDK or imported through channel integrations. Such data could include the click-through rate data of push messages or click rate data of promotional emails. You can create self-serve metrics to visualize such uploaded data in the Overview Dashboard, Actuals Report, and Trend Report.
### Self-serve metrics
Self-serve metrics are metrics you can add to Airbridge and use to create report views, similar to the metrics already available in Airbridge reports.
**Note**
It is advised to use the same definition for events or metrics with the same name across all Apps in your organization. Using consistent names and definitions within the organization can enhance efficiency in analyzing ad performance reports across multiple Apps.
### Data upload
You can upload data as a CSV file to Airbridge using the following methods.
* [Uploading data using the Airbridge dashboard](/en/guides/data-upload-metric-data)
* [Uploading data using the API](/en/references/self-serve-data/upload-metric-data)
The data you upload is not integrated with the data collected through the Airbridge SDK. For example, if you upload data that contains an event with the same name as an Airbridge Standard Event, it will not affect the data collected through the Airbridge SDK in any way. Instead, it will be defined as a self-serve metric with the same name as the Standard Event. This self-serve metric will show the uploaded data, not the data collected through the Airbridge SDK.
### Use cases
Refer to the following use cases to understand how to use self-serve metrics.
App push messages are a powerful tools that can effectively increase a user's lifetime value. Upload a CSV file that contains the number of app push messages sent daily to view the data alongside the ad performance data collected by Airbridge in Airbridge reports.
The performance of app push marketing can be measured by the click-through rate of push messages. You can create a self-serve metric and view the data in your Airbridge reports by uploading the click-through rate to Airbridge.
Another way to view the click-through rate is to create a custom metric using the data you upload and the data collected by Airbridge. You upload the number of push messages sent to Airbridge and define a new custom metric as **the number of push messages sent** divided by **the number of clicks**, which is data collected by Airbridge.
## Creating Metrics to Measure Revenue and Retention of a Targeted Cohort
**Note**
This feature is available across all apps registered within the organization.
You can create cohort metrics to view the revenue or retention data of a specific cohort in the Overview Dashboard, Actuals Report, and Trend Report. For example, you can create a cohort metric to measure the Day 7 user retention or Day 30 revenue of users who installed the app during a specific period. By combining the cohort metrics with other metrics available in the report, you can create a comprehensive report view for daily monitoring.
### Cohort metrics
**Note**
Data from up to 62 days can be aggregated to visualize the cohort metric data.
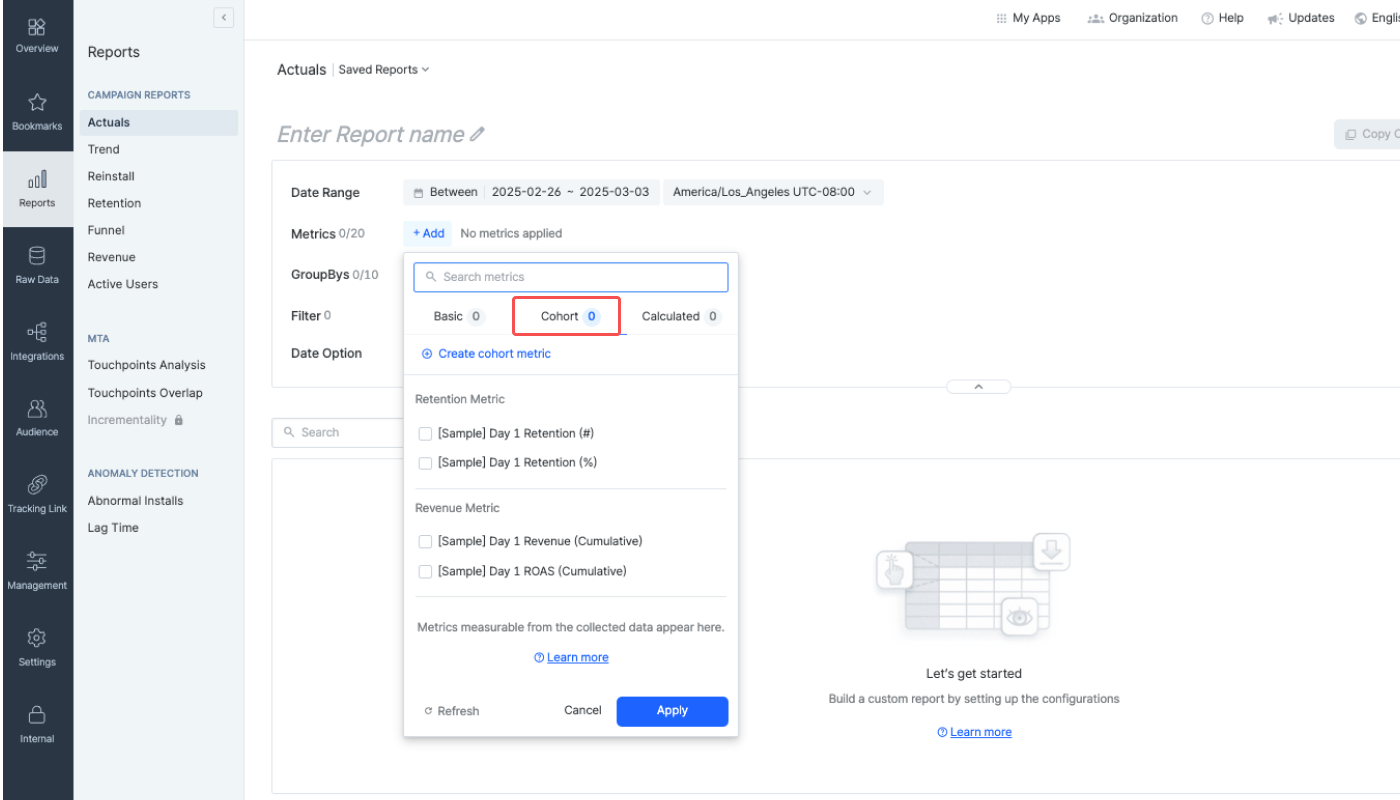
1. In the **\[Reports]>\[Actuals Report]** or **\[Trend Report]**, click **+Add** next to \[Metric] in the report config box.
2. Select the **\[Cohort]** tab and click **Create cohort metric**.
3. Enter the metric name. The name must be unique. For clarity, use descriptive metric names like "Day 7 Revenue" and "Day 3 User Retention (%)."
4. Select Day N.
5. Select Revenue or Retention as metric type and the metric.
**Revenue Metrics**
| Metric | Description |
| ----------- | ------------------------------------------------------------------------------------------------------------------------------------------------------------------- |
| Revenue | Revenue generated by users who performed the Start Event during the set date range and performed the Revenue Event |
| User Count | The number of users who performed the Revenue Event after performing the Start Event during the set date range |
| Event Count | The number of Revenue Events performed by users who performed the Start Event during the set date range |
| ROAS (%) | The return on ad spend based on the revenue generated by users who performed a Revenue Event after performing the Start Event during the set date range |
| ARPU | The average revenue per user based on the revenue generated by users who performed the Start Event during the set date range and performed the Revenue Event |
| ARPPU | The average revenue per paying user based on the revenue generated by users who performed the Start Event during the set date range and performed the Revenue Event |
| PUR (%) | The paying user rate based on the number of users who performed a Revenue Event after performing the Start Event during the set date range |
**Retention metrics**
| Metric | Description |
| ------------------------ | -------------------------------------------------------------------------------------------------------------------------- |
| Retention rate | The percentage of users who, among those who performed the Start Event during the set date range, performed a Return Event |
| Number of retained users | The number of users who, after performing the Start Event during the set date range, performed a Return Event |
When the metric type is Revenue, you can select the view type. When the metric type is Retention, you can select the measurement option.
**View Types for Revenue metrics**
The available view types vary depending on the Revenue Event.
| **View Type** | **Description** |
| ----------------- | --------------------------------------------------------- |
| Cumulative | The running sum of all metric data calculated up to Day N |
| Non-Cumulative | The metric data of Day N only |
| Cumulative-Unique | The sum of uniques up to Day N |
**Measurement Options for Retention metrics**
| **Measurement Option** | **Description** |
| ---------------------- | ------------------------------------------------------------------------------------------ |
| General | The user retention based on all Start Events that occurred during the set date range |
| Confined | The user retention based on the latest Start Event that occurred during the set date range |
6. The Start Event is fixed to **Install (App)**, which is the indicator of the user's entry into your service. Data of users who didn't perform the Start Event are not aggregated. Note that GroupBys are applied to the Start Event data.
7. Select the Return Event or Revenue Event, depending on the metric type you selected. You can select up to 5 events.
* [Revenue Event](/en/guides/understanding-the-revenue-report#revenue-event): When a user performs the Revenue Event, the user is determined to have generated revenue, which is aggregated to measure the Day N metric.
* [Return Event](/en/guides/retention-report-viewing#return-event): When a user performs the Return Event, the user is determined to have returned to the service and is aggregated to measure the Day N metric.
8. Click **Create**. The cohort metric will appear in the **\[Cohort]** tab of the metric selector in the Overview Dashboard, Actuals Report, and Trend Report for all apps within your organization.
### Basic features
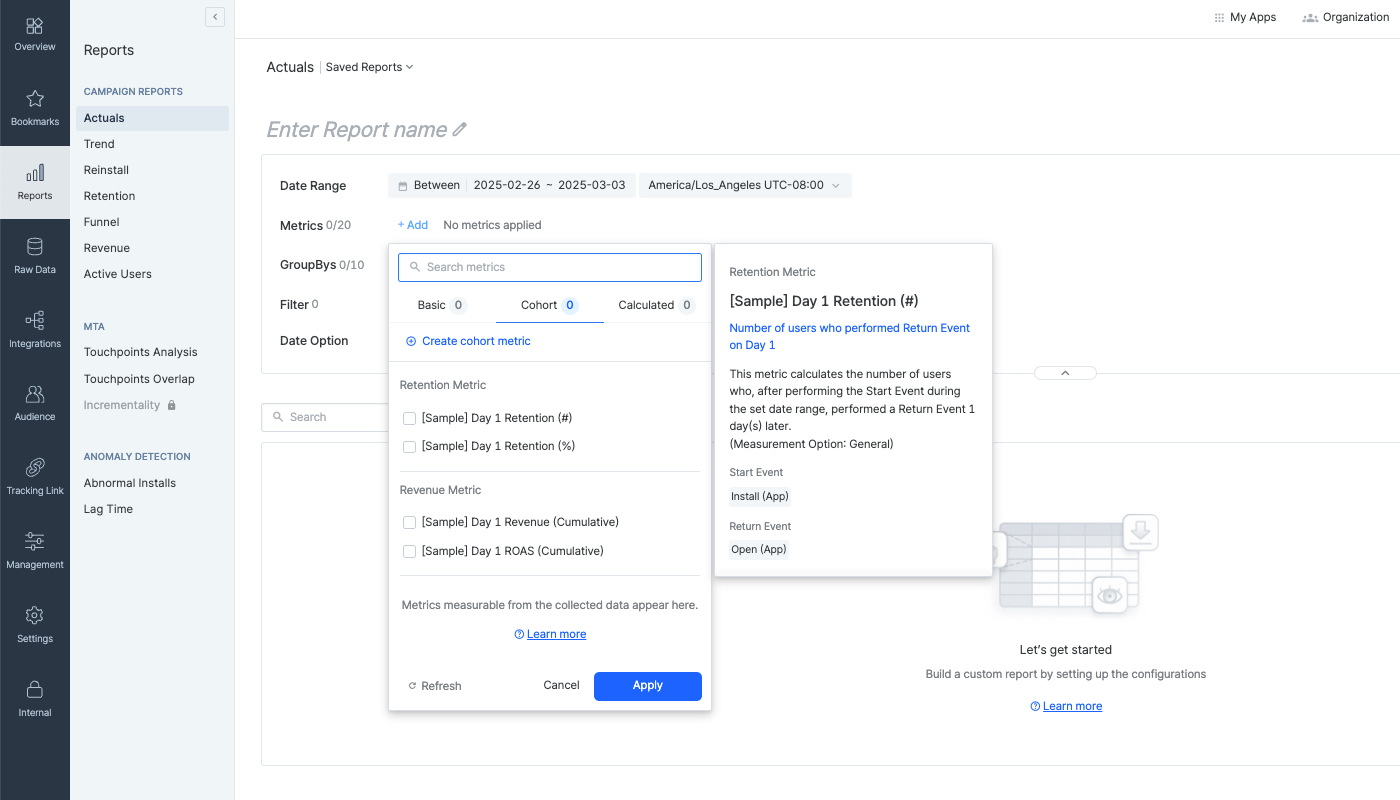
Hover over or click a metric to view the definition.
**Attention**
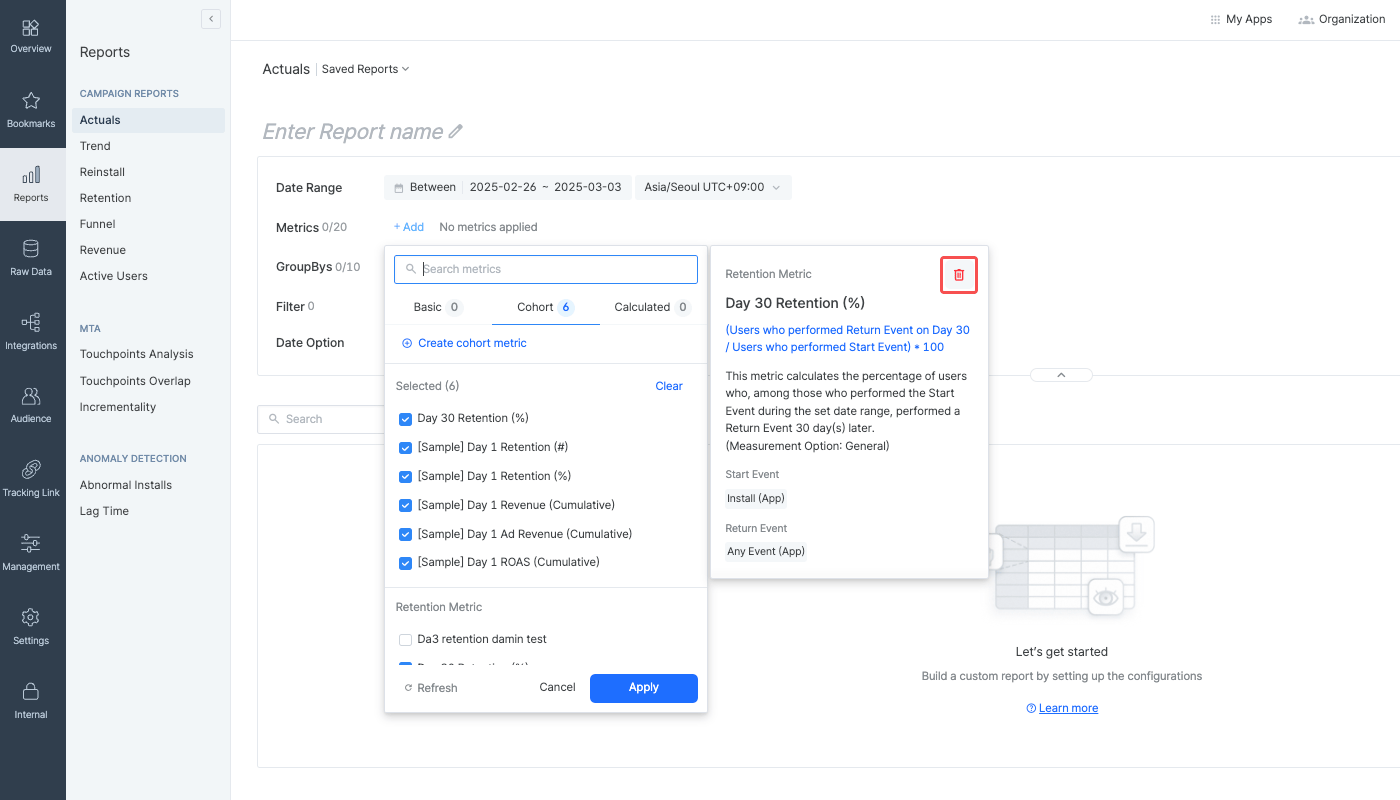
When a cohort metric is deleted, the metric data is deleted in all reports where it was supported.
Hover over or click a Day N metric and click the **\[trash]** icon to delete the cohort metric. Any Airbridge user can delete a cohort metric regardless of their app roles.
### Use cases
Refer to the following use cases to understand how to use cohort metrics.
You can monitor the retention and revenue generated by users who have installed the app and been active for a specific period to plan targeted marketing activities.
Let's say you have an e-commerce app. In the Actuals Report, visualize the number of users who installed the app, the number of retained users up to the 7th day after install, and the cumulative revenue up to the 7th day after install. Based on the data, you might consider implementing marketing activities to boost sales, such as offering coupons and launching promotions.
To do so, you need the following metrics:
* Basic metric: **Install Users (App)**
* Cohort metric: **Day 7 New User Retention (%)**, **Day 7 Retained Users (#)**, **Day 7 New User Revenue**
Here is how you can create the cohort metrics:
* **Day 7 New User Retention (%)**: Configure Day N as **Day 7**, the metric type as **Retention,** data display as **%**, Start Event as **Install (App)**, and Return Event as **Open (App).**
* **Day 7 Retained Users (#)**: Configure Day N as **Day 7**, the metric type as **Retention,** data display as **#**, Start Event as **Install (App)**, and Return Event as **Open (App).**
* **Day 7 New User Revenue**: Configure Day N as **Day 7**, the metric type and metric as **Revenue**, Start Event as **Install (App)**, and Revenue Event as **Order Complete (App).**
You can monitor the health of your service by visualizing the cumulative revenue that users generate over a certain period.
Let's say you have a gaming app and want to track the cumulative ad revenue generated over 1 month after users have installed the app.
To do so, you need the following metric:
* Cohort metric: **Day 30 New User Ad Revenue**
Here is how you can create the cohort metric:
* **Day 30 New User Ad Revenue**: Configure Day N as **Day 30**, the metric type and metric as **Revenue**, view type as **Cumulative**, Start Event as **Install (App)**, and Return Event as **Ad Impression (App)**.
## Creating Metrics Using Formulas
You can create new metrics using formulas to define key indicators that meet your marketing needs and use them in the Overview Dashboard, Actuals Report, and Trend Report.
### Custom metrics
**Note**
This feature is available across all apps registered within the organization.
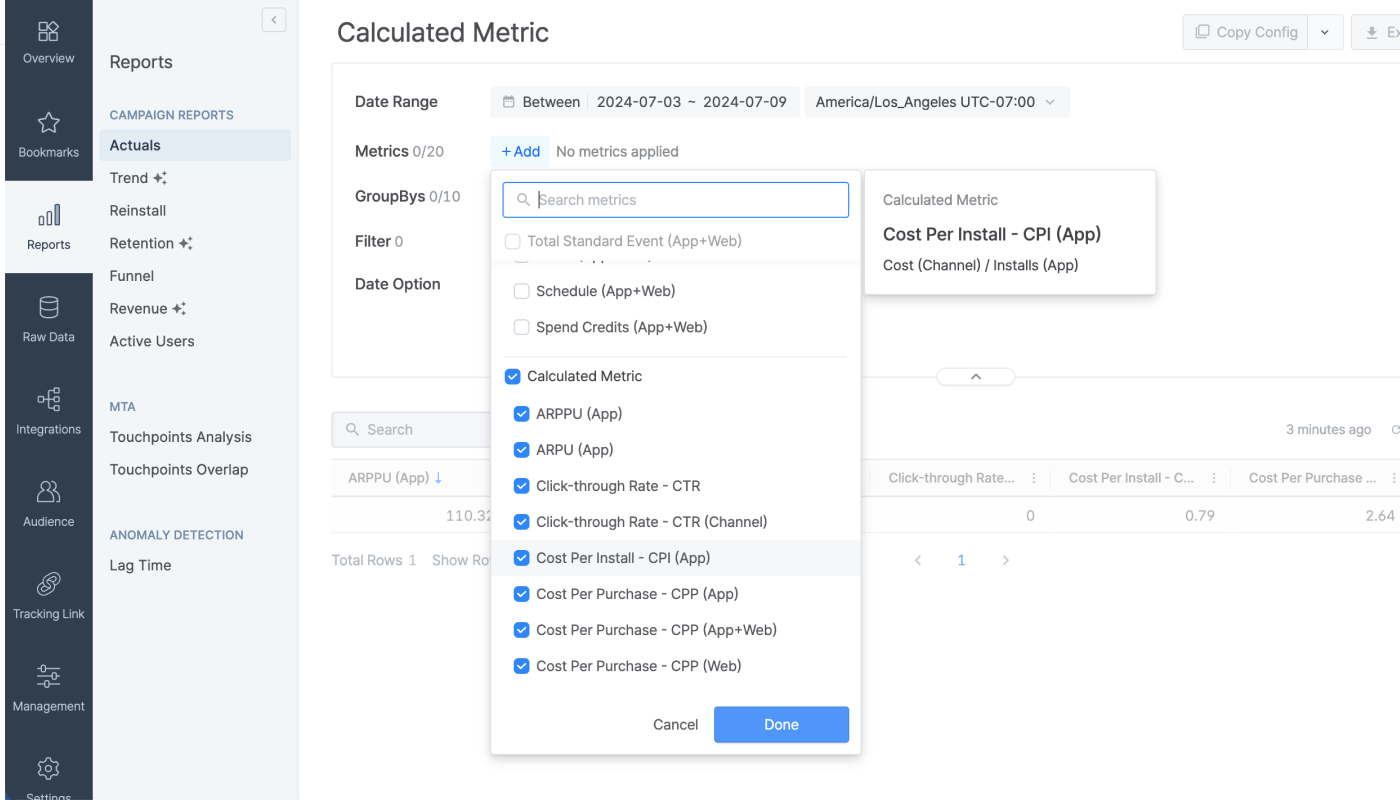
Custom metrics are metrics Airbridge users can add to Airbridge by defining them using formulas, such as CPI (Cost Per Install), CPA (Cost Per Action), etc. They can be used to create report views similar to the metrics already available in Airbridge reports.
Custom metrics are available across all apps registered with the organization. However, some custom metrics may be defined using components that only work as intended for specific apps. For more details, refer to this [section](/en/guides/custom-metric-manager) of the article.
| Components | Description | Example |
| ---------- | ---------------------------------------------------------------------------- | --------------------- |
| Metric | Standard/Custom Event metrics (Category), Cohort metrics, Self-serve metrics | Sign-up (App), PUR(%) |
| Numbers | Real numbers | -10, 3.14, 1000 |
| Operators | Arithmetic operators and parentheses | +, −, ÷, ×, (, ) |
### Use cases
Refer to the following use cases to understand how to use custom metrics.
CTR (Click-Through Rate) measures the ratio of clicks to ad impressions. A high CTR for ads using a specific keyword or creative indicates strong performance. To track CTR, create a custom metric as follows:
* CTR = Clicks / Impressions \* 100
If your team measures performance by the ratio of revenue to a key owned media metric, you can create a custom metric as follows:
* RpO(Revenue per OwnedMedia) = Revenue (App) / OwnedMedia
Airbridge cannot collect owned media data directly. You must upload the OwnedMedia values as [self-serve metrics](/en/guides/creating-metrics#self-serve-metrics) to use them in the formulas. For example, you can upload blog visits, social media likes, or video platform views as self-serve metrics.
## Attention
App A and App B are in the same organization. Both apps use the following custom events and self-serve metric.
| Event/Metric | push\_sent (custom event) | in\_app\_sent (custom event) | push\_clicked (self-serve metric) |
| ------------ | ------------------------- | ---------------------------- | --------------------------------- |
| App A | Collected | Collected | Collected |
| App B | Collected | Collected | Not collected |
Assume custom metrics are defined as follows.
* message\_sent = push\_sent + in\_app\_sent
* push\_click\_rate = (push\_clicked / push\_sent) \* 100
In the results for each app, App A can see both custom metrics. However, App B shows push\_click\_rate as 0 because App B does not collect the push\_clicked metric.
| App | message\_sent | push\_click\_rate |
| ----- | ------------- | ---------------------------------------------------------------------- |
| App A | Available | Available |
| App B | Available | Unavailable (Shown as 0 because push\_clicked metric is not collected) |
 ### Cohort metrics
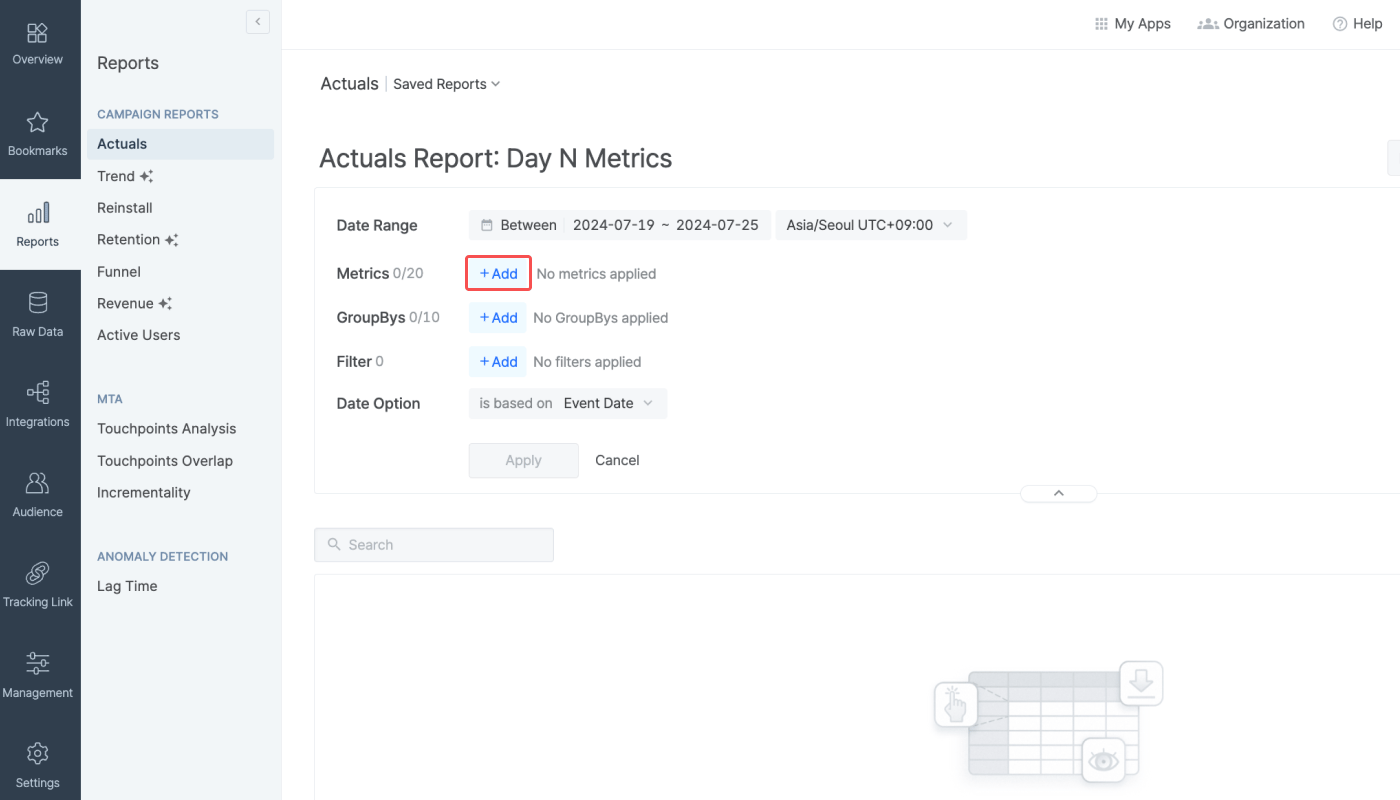 2. Select the **\[Cohort]** tab and click **Create cohort metric**.
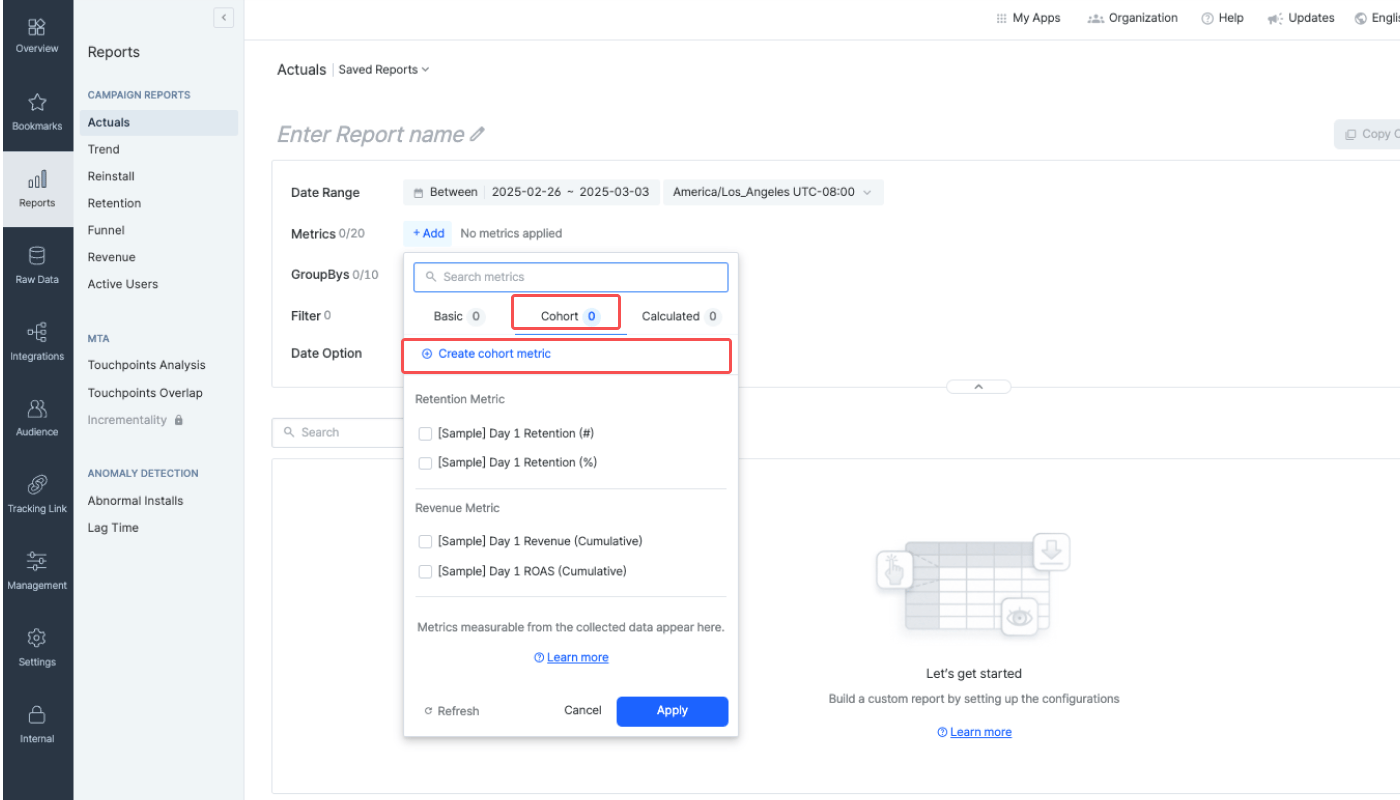 3. Enter the metric name. The name must be unique. For clarity, use descriptive metric names like "Day 7 Revenue" and "Day 3 User Retention (%)."
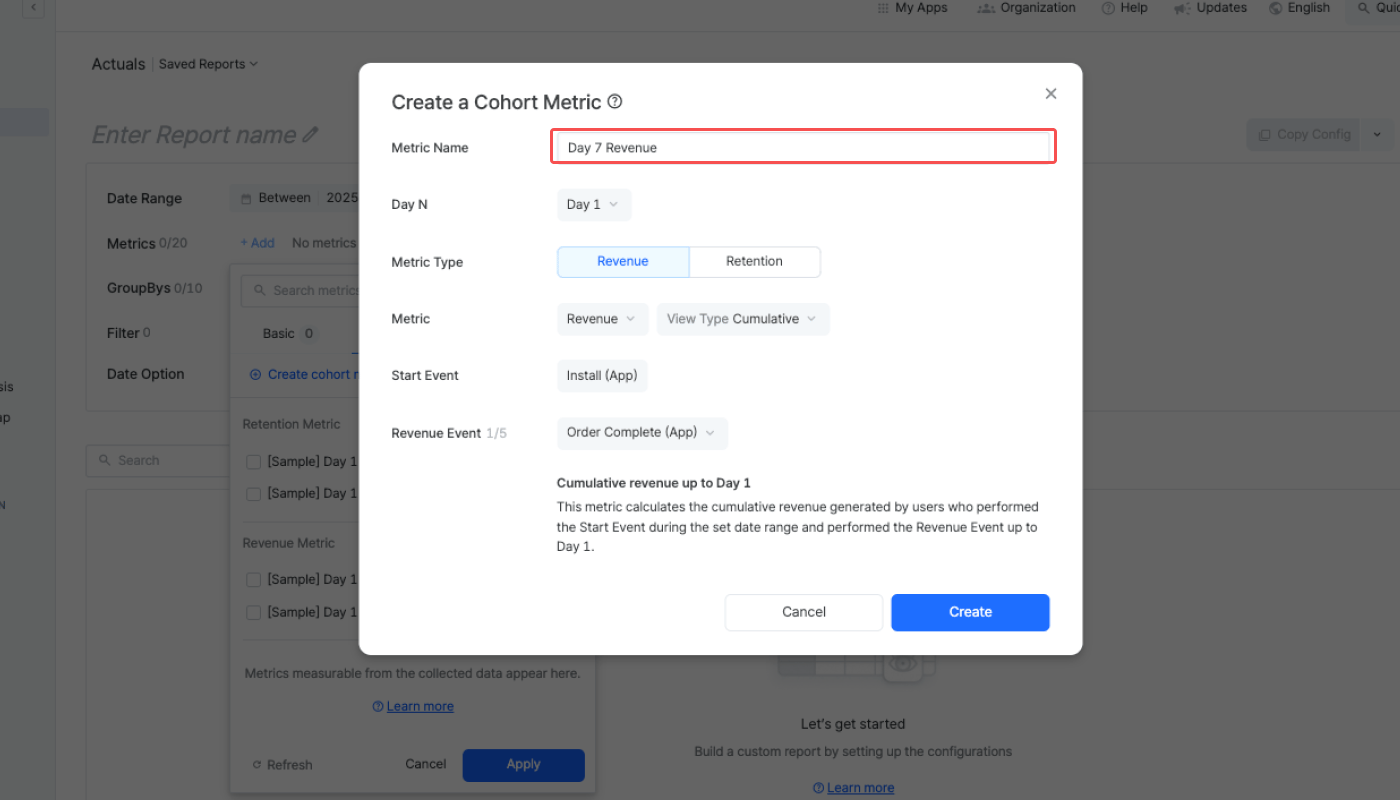 4. Select Day N.
5. Select Revenue or Retention as metric type and the metric.
4. Select Day N.
5. Select Revenue or Retention as metric type and the metric.
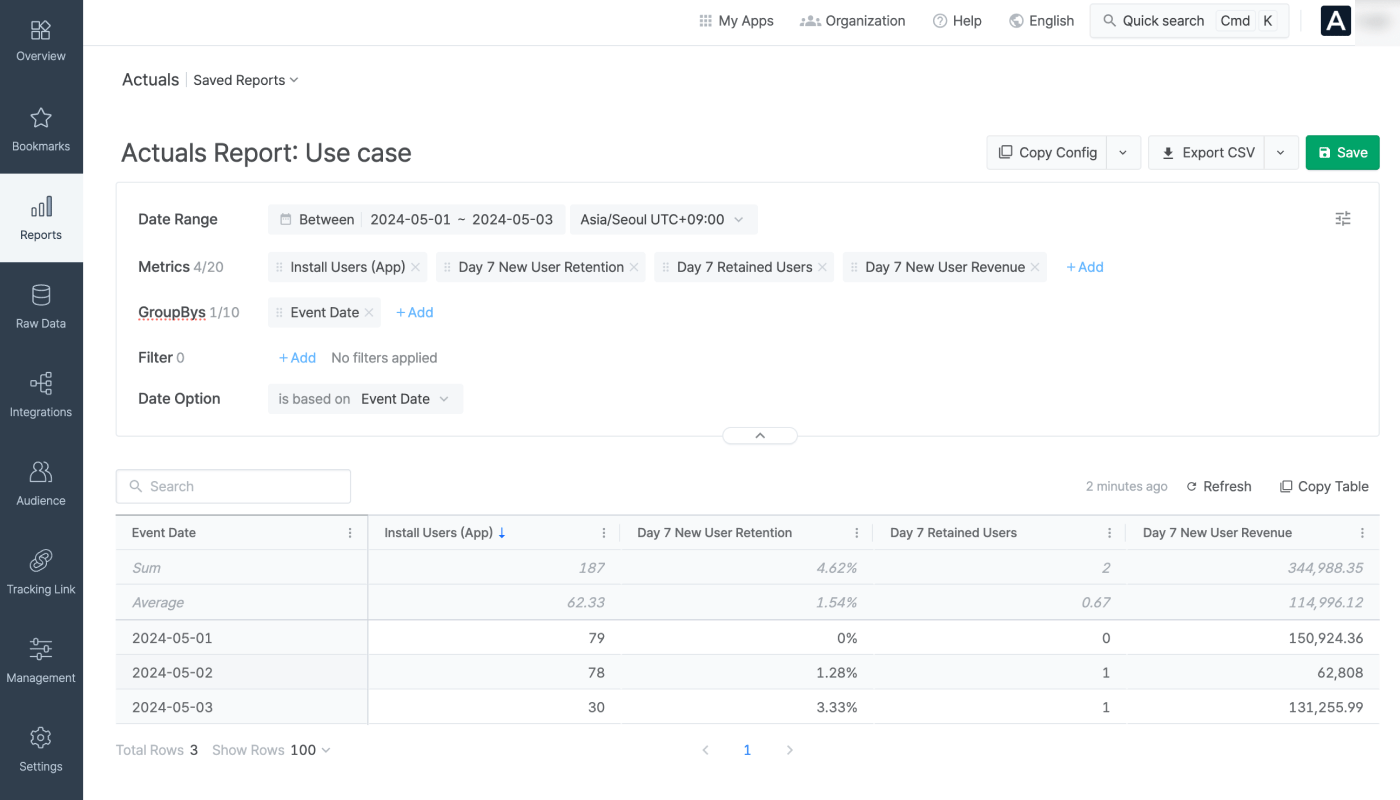 Here is how you can create the cohort metrics:
* **Day 7 New User Retention (%)**: Configure Day N as **Day 7**, the metric type as **Retention,** data display as **%**, Start Event as **Install (App)**, and Return Event as **Open (App).**
* **Day 7 Retained Users (#)**: Configure Day N as **Day 7**, the metric type as **Retention,** data display as **#**, Start Event as **Install (App)**, and Return Event as **Open (App).**
* **Day 7 New User Revenue**: Configure Day N as **Day 7**, the metric type and metric as **Revenue**, Start Event as **Install (App)**, and Revenue Event as **Order Complete (App).**
Here is how you can create the cohort metrics:
* **Day 7 New User Retention (%)**: Configure Day N as **Day 7**, the metric type as **Retention,** data display as **%**, Start Event as **Install (App)**, and Return Event as **Open (App).**
* **Day 7 Retained Users (#)**: Configure Day N as **Day 7**, the metric type as **Retention,** data display as **#**, Start Event as **Install (App)**, and Return Event as **Open (App).**
* **Day 7 New User Revenue**: Configure Day N as **Day 7**, the metric type and metric as **Revenue**, Start Event as **Install (App)**, and Revenue Event as **Order Complete (App).**
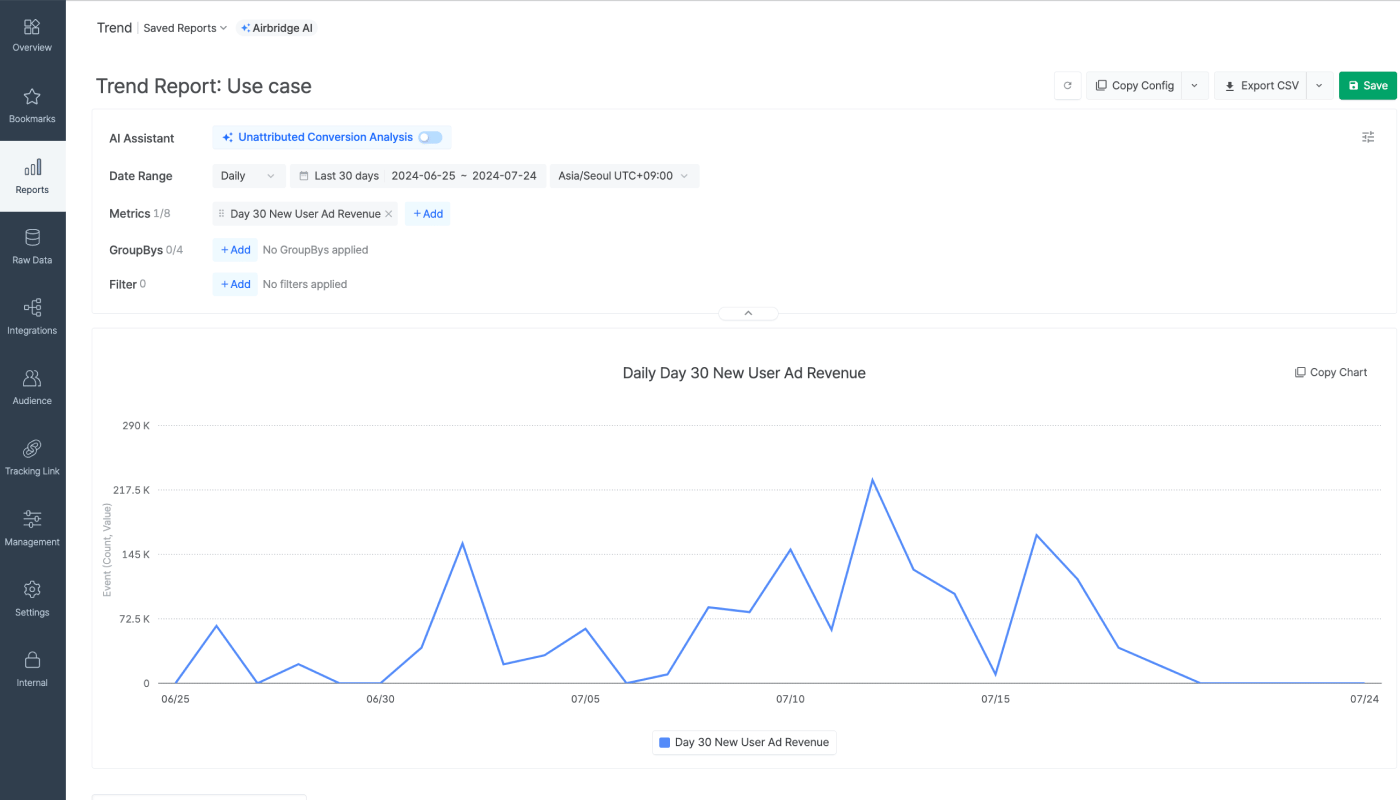 Here is how you can create the cohort metric:
* **Day 30 New User Ad Revenue**: Configure Day N as **Day 30**, the metric type and metric as **Revenue**, view type as **Cumulative**, Start Event as **Install (App)**, and Return Event as **Ad Impression (App)**.
Here is how you can create the cohort metric:
* **Day 30 New User Ad Revenue**: Configure Day N as **Day 30**, the metric type and metric as **Revenue**, view type as **Cumulative**, Start Event as **Install (App)**, and Return Event as **Ad Impression (App)**.
 ### Custom metrics