> ## Documentation Index
> Fetch the complete documentation index at: https://help.airbridge.io/llms.txt
> Use this file to discover all available pages before exploring further.
# Abnormal Installs Analysis Powered by the AI Assistant
The Abnormal Install Report uses the AI Assistant to show the number and types of abnormal installs. Understand the trend of abnormal installs and start taking action against ad fraud.
Abnormal Installs Analysis
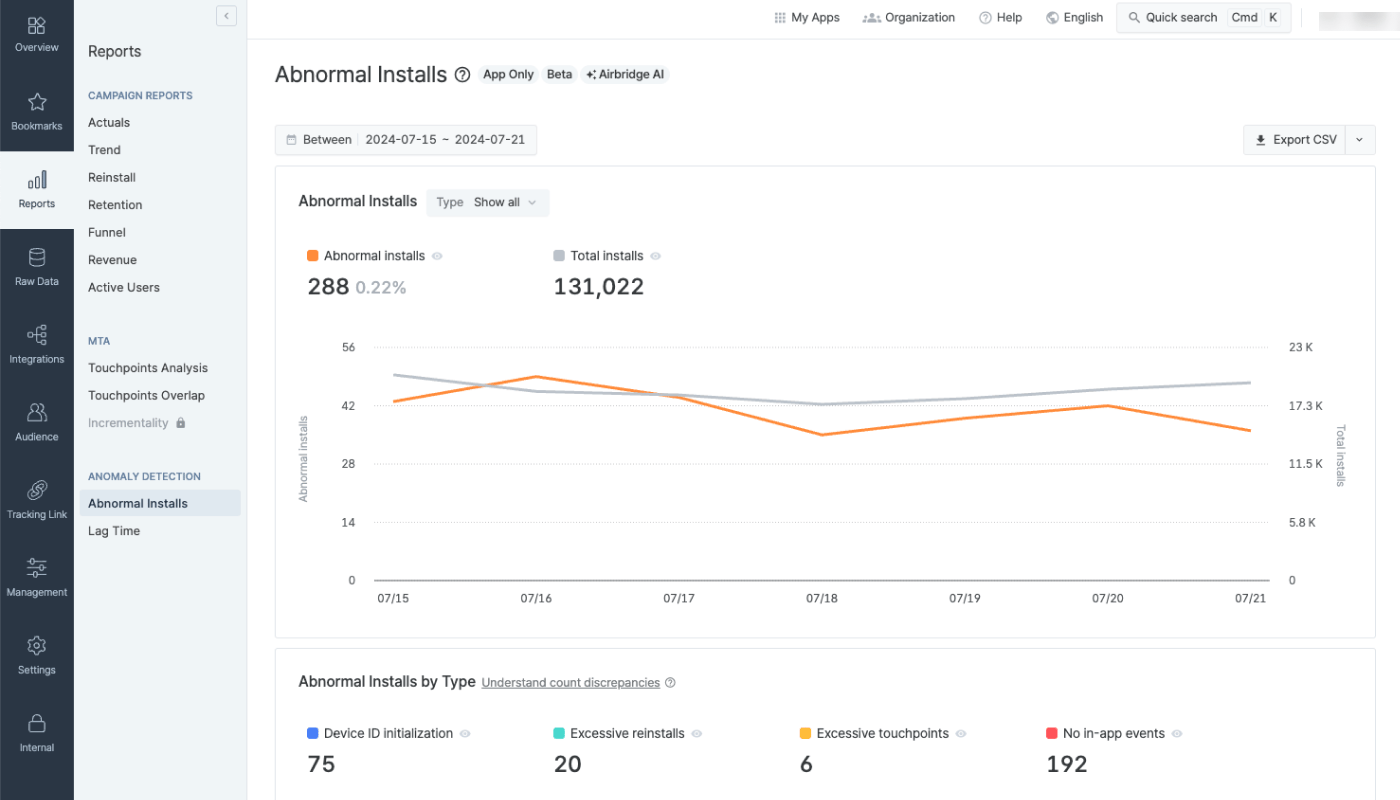
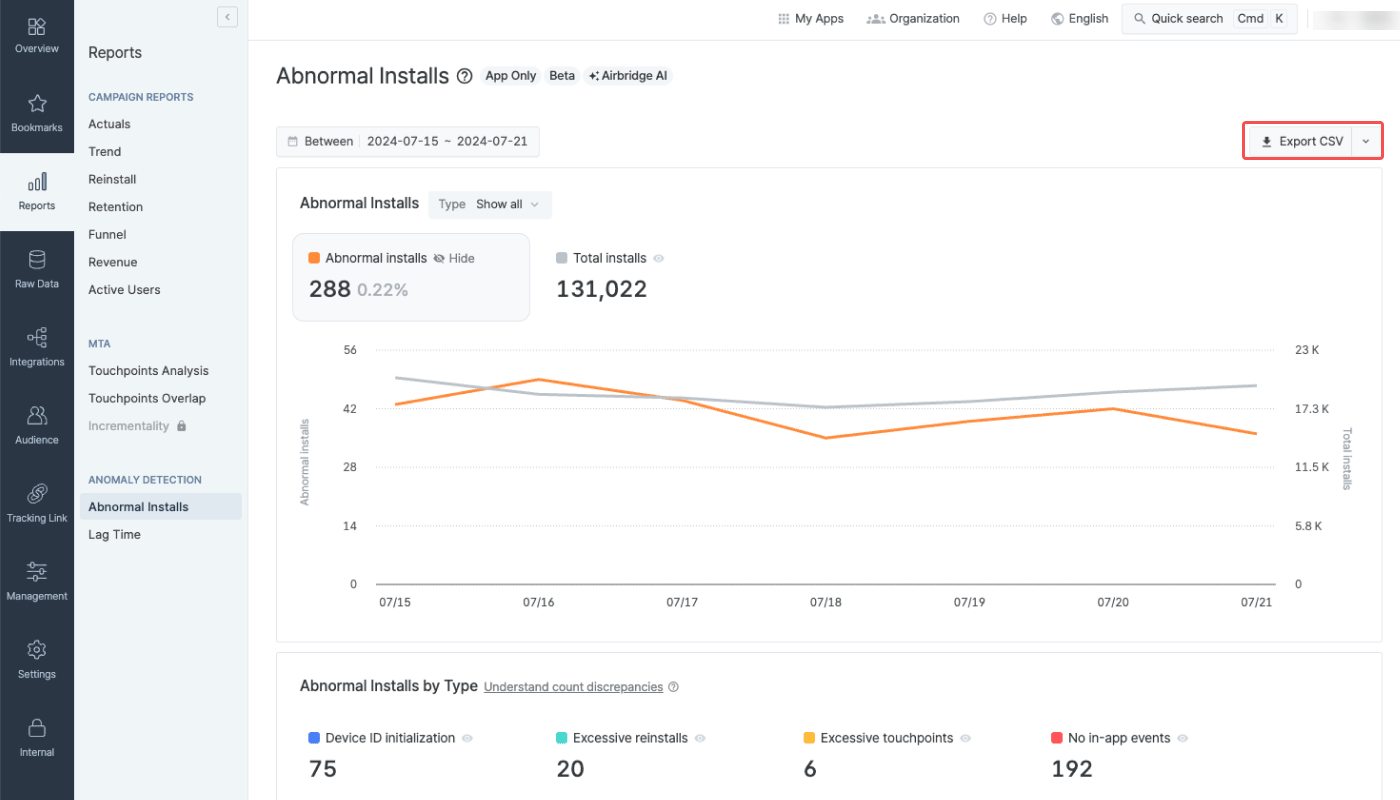
The Abnormal Installs Report shows the daily number and percentage of abnormal installs in relation to the total number of installs. You can also view abnormal installs by type.
You can download the raw data of abnormal install events as a CSV file for further analysis. The Abnormal Installs Report can help you make informed decisions about handling abnormal installs in the ad performance measurement process and configuring the [fraud validation rules](/en/guides/fraud-validation-rules).
How it works
**Attention**
Only Owners and In-house Marketers can access the Abnormal Installs Report. Refer to this [article](/en/guides/user-management#app-roles) to learn about app roles.
The AI Assistant uses past data learning to determine whether an install is abnormal or not.
The feature is currently in beta and comes with the following limitations.
* The date range can be selected from 2 days (D-2) to 94 days (D-94) prior to today. Data is available from May 1, 2024 onwards.
* The chart shows daily data.
Requirements
For the AI Assistant to function, the following requirements must be met. The AI Assistant can readily perform the analysis for newly registered Airbridge Apps as well if only the data requirements are met. Only data from Integrated Channels are used.
* At least 30 days’ worth of Install (App) event data is required, and the Install (App) event must have been collected at least once daily.
* The data does not need to be continuous. For example, if the campaign ran from 2024-09-01 to 2024-09-17 and from 2024-10-15 to 2024-10-30, the data is still viable for analysis.
Understanding the Abnormal Installs Report
**Attention**
The Abnormal Installs Report is intended solely for reporting the install events that the AI Assistant has identified as abnormal. How to handle the abnormal installs reported by the AI Assistant is up to the Airbridge users to decide. Refer to this [section](/en/guides/abnormal-installs-report#insights-and-actions-that-can-be-driven-by-the-abnormal-installs-report) of the article to learn more.
The Abnormal Installs Report provides data in charts and raw data. The abnormal installs are classified into 4 types based on the factors the AI Assistant uses to report them as abnormal installs.
The types of abnormal installs have been defined based on the results of the abnormal install analysis.
| Type | Description |
| ------------------------ | ------------------------------------------------------------------------------------------------------------------------------------------------------------ |
| Device ID initialization | More than 5 installs after device ID initialization have been collected in the past 30 days. |
| Excessive reinstalls | More than 5 app installs have been collected in the past 30 days from a single device based on the [device ID](/en/guides/identifiers#types-of-identifiers). |
| Excessive touchpoints | More than 10 touchpoints were collected 24 hours before the app install. Abnormal CTIT pattern detected. |
| No in-app events | No in-app events were collected within 24 hours after the app install. Abnormal CTIT pattern detected. |
Chart
The Abnormal Installs Report provides data in line charts. Understand the context of abnormal installs by comparing their number to the total installs and exploring the breakdown of abnormal installs by type.
Abnormal installs trend chart
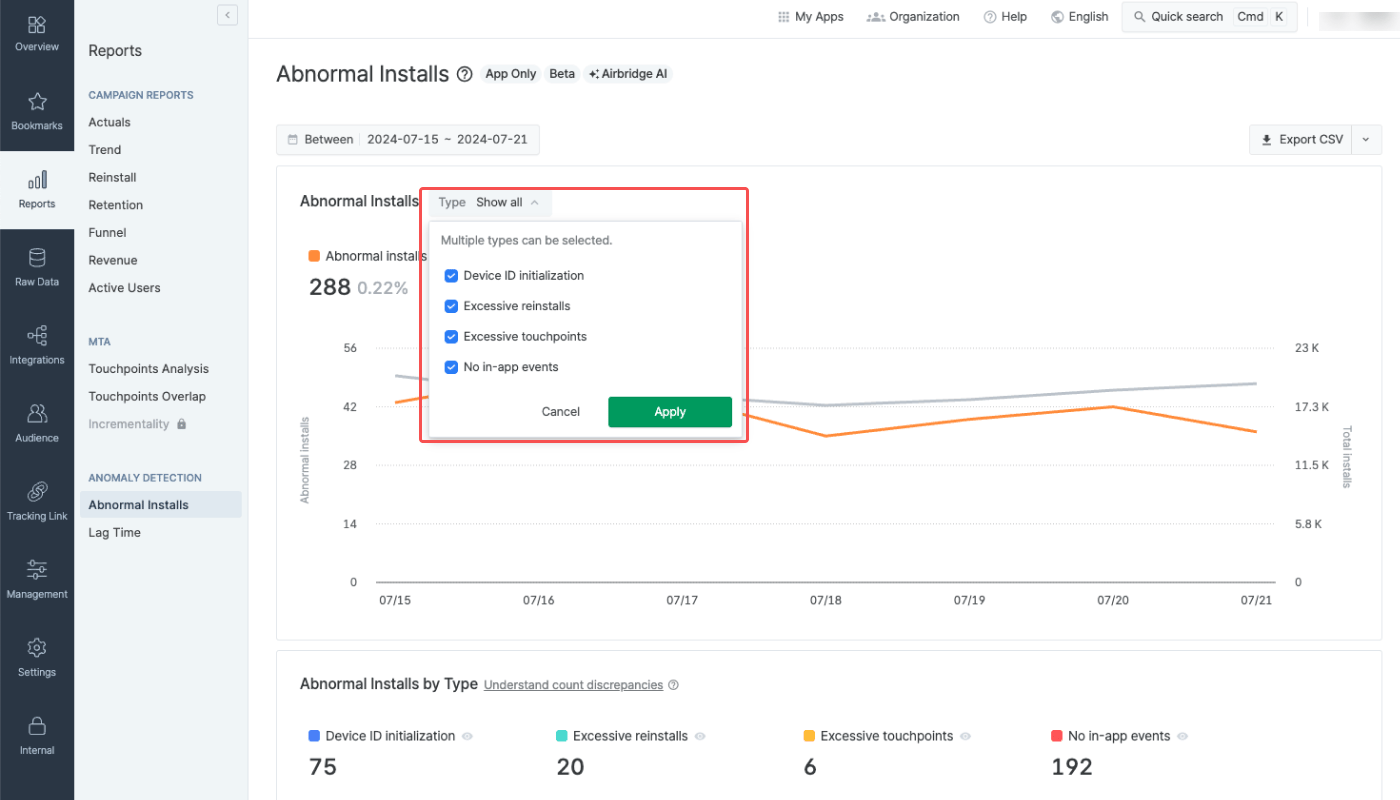
The first chart visualizes the number of total installs and abnormal installs that occurred during the set date range. Click the **\[Types]** selector, check the abnormal install types you want to visualize in the chart and click **Apply**.
Hovering over a specific area in the chart will display the data points for the closest date. Hovering over a specific item's trend line will highlight only that item's trend line. You can hide specific items from the chart by clicking the **\[eye]** icon next to the item's name under the chart title.
Review the trend of abnormal installs in relation to the total number of installs to gain insights for your campaign management. For example, if the number of abnormal installs increases compared to the total number of installs during a specific period, it suggests that campaigns run during that period may have a higher-than-average rate of abnormal installs. Conversely, if the number of abnormal installs decreases compared to the total number of installs during a specific period, it suggests that campaigns terminated during that period may have a higher-than-average rate of abnormal installs.
Abnormal installs by type chart
**Attention**
Abnormal installs can overlap across multiple types. This means that the sum of abnormal install counts by type may exceed the total number of abnormal installs.
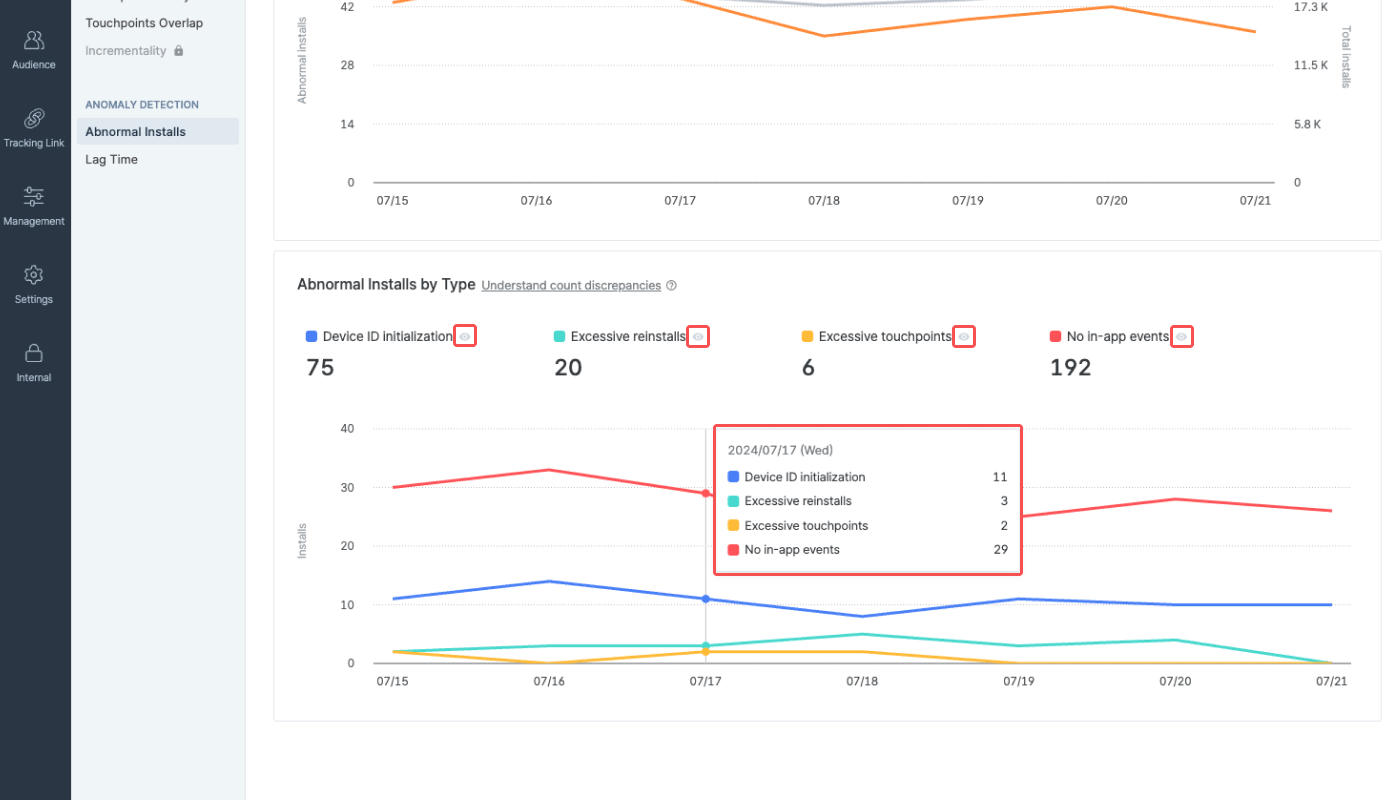
The second chart visualizes the number of abnormal installs by type during the set date range.
Hovering over a specific area in the chart will display the data points for the closest date. Hovering over a specific item's trend line will highlight only that item's trend line. You can hide specific items from the chart by clicking the **\[eye]** icon next to the item's name under the chart title.
Raw data
Click **Export CSV** to download the raw data as a CSV file and view the result in detail.
In the CSV file, you can see the abnormal installs and their types. `TRUE` indicates the type of the abnormal install. `FALSE` indicates the type is non-relevant to the install.
You can also check the ad channel from which the abnormal install occurred. The CSV file contains details such as the device ID, OS name and version, country, and IP address. Using such data can help you identify the common factors of abnormal installs and create [fraud validation rules](/en/guides/fraud-validation-rules) to flag ad fraud within Airbridge.
Attention
The Abnormal Installs Report is intended solely for reporting the install events that the AI Assistant has identified as abnormal. It is designed to provide data to help you determine whether to exclude the reported abnormal installs from the overall measurement process.
To ensure more accurate ad performance measurement, you can configure the fraud validation rules based on the abnormal install analysis results.
The Abnormal Installs Report aggregates the installs based on the Airbridge App timezone set when registering the app with Airbridge. Therefore, there may be discrepancies between the number of installs in some Airbridge reports where the timezone is configurable and is set to a different timezone that the Airbridge App timezone and the number of installs in the Abnormal Installs Report. The Airbridge App timezone can be found on the **\[Settings]>\[App Settings]** page in the Airbridge dashboard.
 The feature is currently in beta and comes with the following limitations.
* The date range can be selected from 2 days (D-2) to 94 days (D-94) prior to today. Data is available from May 1, 2024 onwards.
* The chart shows daily data.
The feature is currently in beta and comes with the following limitations.
* The date range can be selected from 2 days (D-2) to 94 days (D-94) prior to today. Data is available from May 1, 2024 onwards.
* The chart shows daily data.
 Hovering over a specific area in the chart will display the data points for the closest date. Hovering over a specific item's trend line will highlight only that item's trend line. You can hide specific items from the chart by clicking the **\[eye]** icon next to the item's name under the chart title.
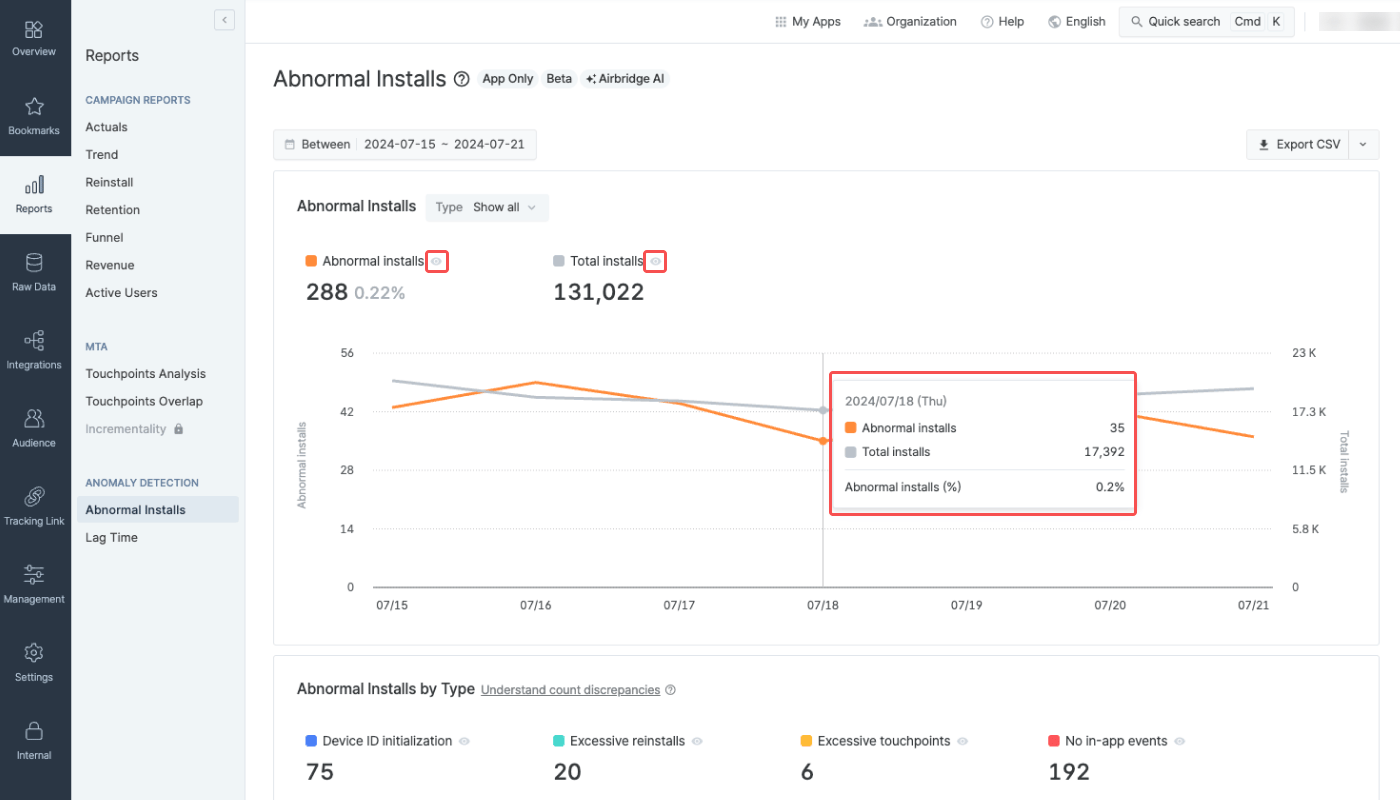 Review the trend of abnormal installs in relation to the total number of installs to gain insights for your campaign management. For example, if the number of abnormal installs increases compared to the total number of installs during a specific period, it suggests that campaigns run during that period may have a higher-than-average rate of abnormal installs. Conversely, if the number of abnormal installs decreases compared to the total number of installs during a specific period, it suggests that campaigns terminated during that period may have a higher-than-average rate of abnormal installs.
 In the CSV file, you can see the abnormal installs and their types. `TRUE` indicates the type of the abnormal install. `FALSE` indicates the type is non-relevant to the install.
You can also check the ad channel from which the abnormal install occurred. The CSV file contains details such as the device ID, OS name and version, country, and IP address. Using such data can help you identify the common factors of abnormal installs and create [fraud validation rules](/en/guides/fraud-validation-rules) to flag ad fraud within Airbridge.
In the CSV file, you can see the abnormal installs and their types. `TRUE` indicates the type of the abnormal install. `FALSE` indicates the type is non-relevant to the install.
You can also check the ad channel from which the abnormal install occurred. The CSV file contains details such as the device ID, OS name and version, country, and IP address. Using such data can help you identify the common factors of abnormal installs and create [fraud validation rules](/en/guides/fraud-validation-rules) to flag ad fraud within Airbridge.