> ## Documentation Index
> Fetch the complete documentation index at: https://help.airbridge.io/llms.txt
> Use this file to discover all available pages before exploring further.
# DeepLink - Actuals Report
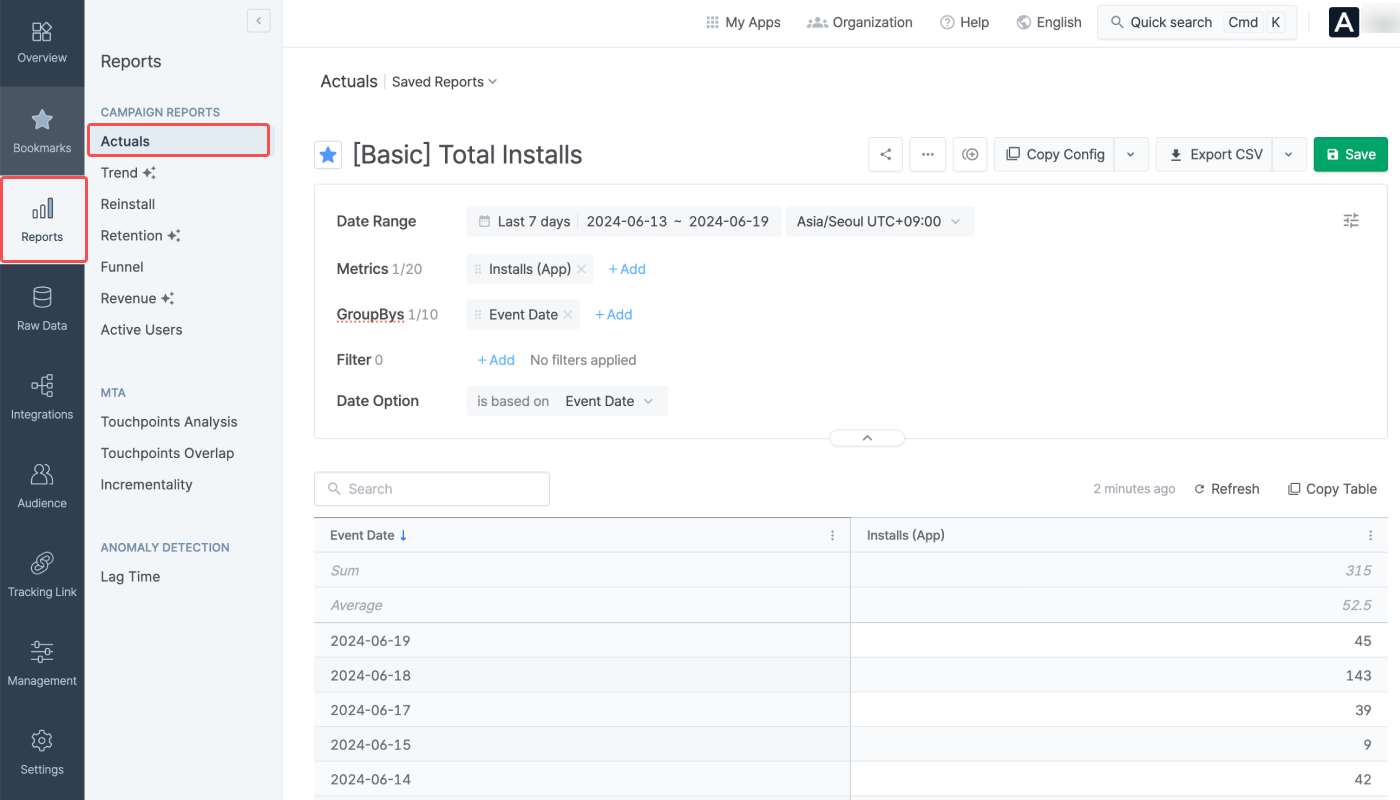
The Actuals Report is the go-to report for monitoring ad performance. You can configure the metrics, GroupBys, and filters, to create a customized real-time report view that suits your marketing needs. The Actuals Report can be accessed from the **\[Reports]>\[Actuals]** on the left menu bar.
## **Configuring a Report View**
The configuration box offers options for configuring the date range, metrics, GroupBys, and filters. The chosen metrics will be displayed by the selected GroupBys in the table. When setting up filters, only the data that meets the filter conditions will be displayed.
### Date range
The Actuals Report shows the metric data measured during the set date range. Use the calendar filter to configure the date range.
* Data provision period: 5 years (applied from February 1, 2023)
* Maximum period that can be configured for a report view: 400 days
The date range conditions available in the calendar filter are as follows.
The date range can be set using the following conditions.
| Condition | Date Range |
| --------- | ---------------------------------------- |
| Between | From start date to end date |
| Since | From start date to today |
| Last | Last n days/weeks/months until yesterday |
When using “Last,” options such as “Include today,” “Include this month,” and “Offset” can be added.
For example, if you select **Last 30 days** and add **Offset + 3 days**, the date range will start 33 days before today and end 4 days before today.
### Time zone
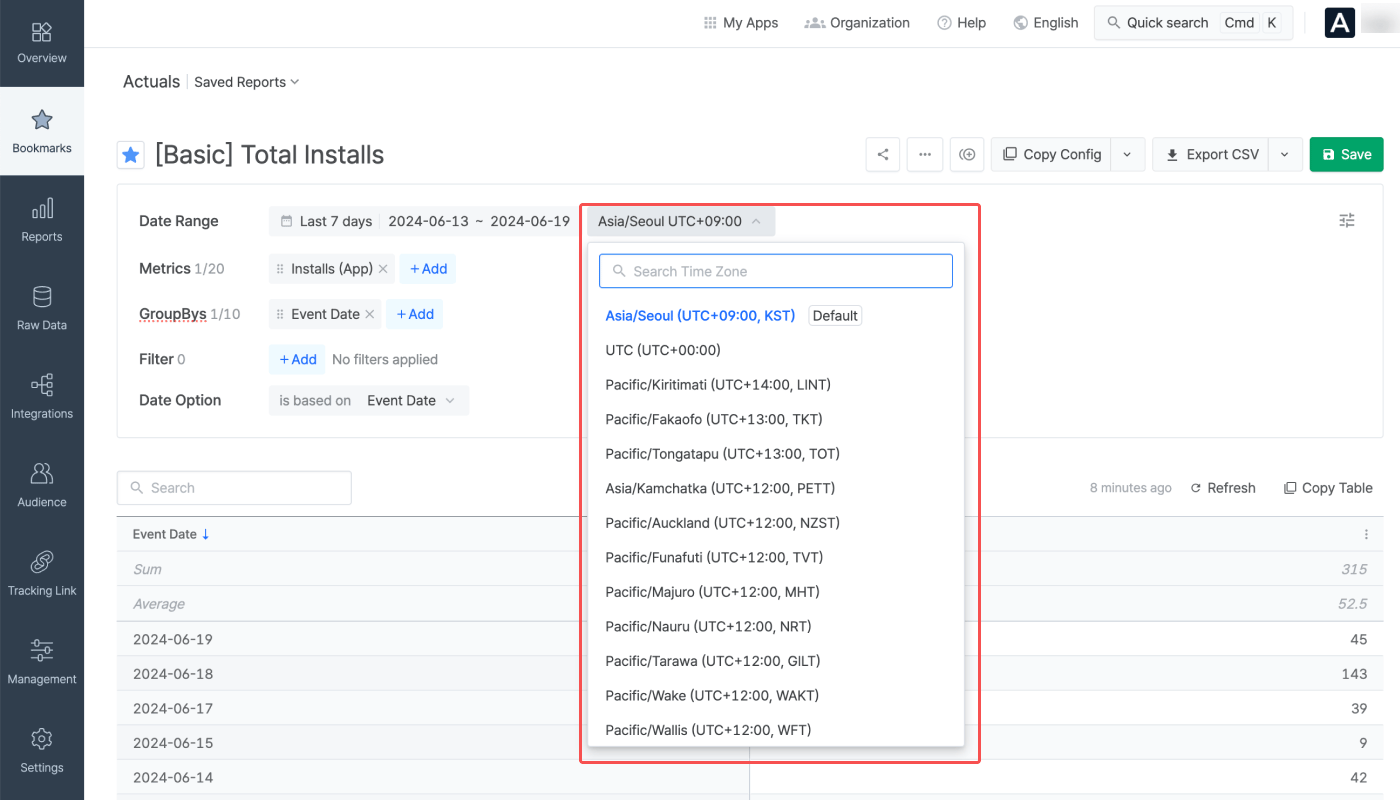
You can select the time zone of your choice for creating the report view. The default time zone is the same as the Airbridge App time zone.
### Metrics
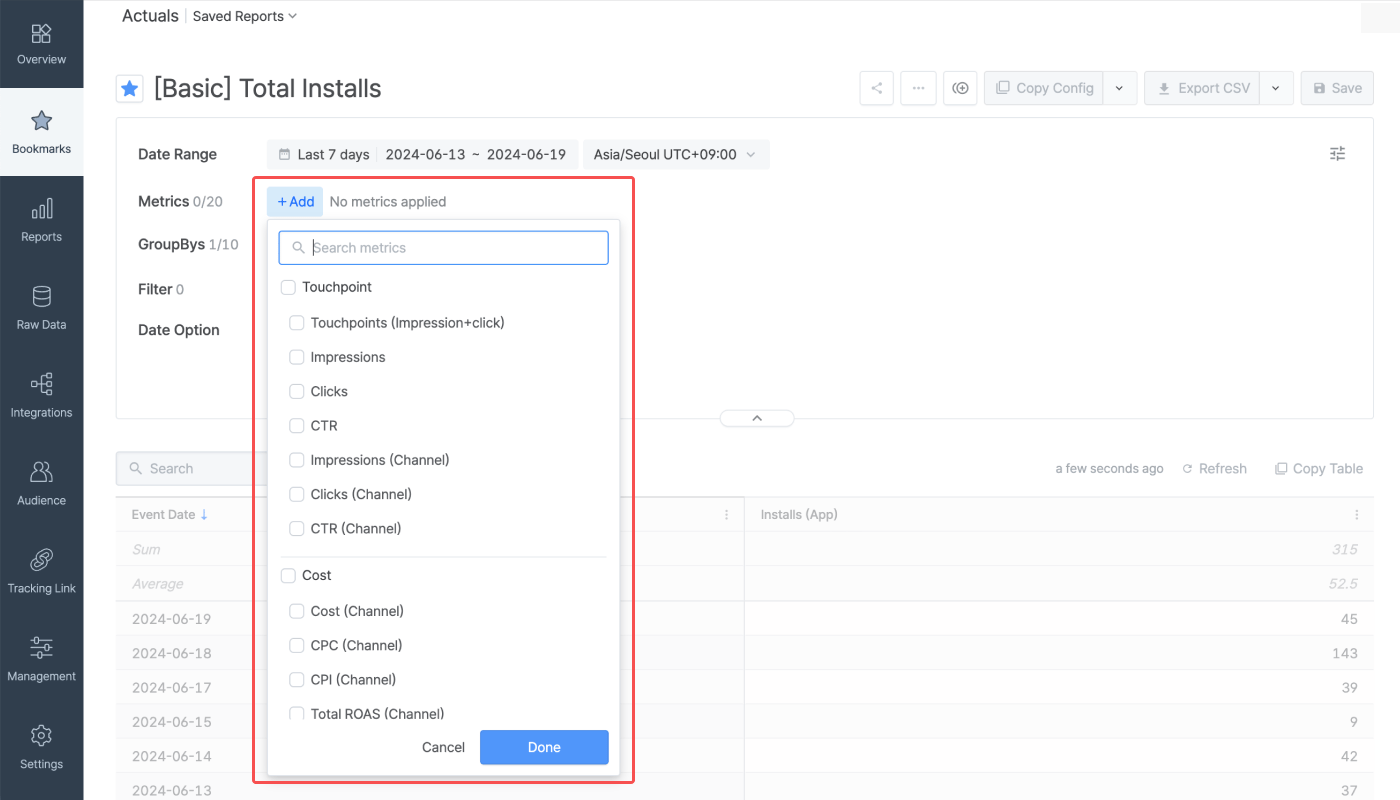
The data collected through tracking links, Airbridge SDK, and ad channels can be viewed in the Actuals Report based on the selected metrics. Up to 20 metrics can be configured to create a report view.
When selecting events as metrics, the event count data is displayed. For example, when selecting Installs (App) as a metric, the report will show the number of the Installs (App) `e`vents that occurred during the set date range.
When selecting a metric with "user" in the metric name, you can visualize the unique user count of users who have performed Standard Events or Custom Events that have been collected more than once through the SDK.
The unique user count data is refreshed every 1 hour. For example, the number of unique users who triggered the Subscribe event between 12:00 PM and 1:00 PM can be visualized on the dashboard by selecting the Subscribe Users (App) metric after 1:00 PM.
### GroupBys
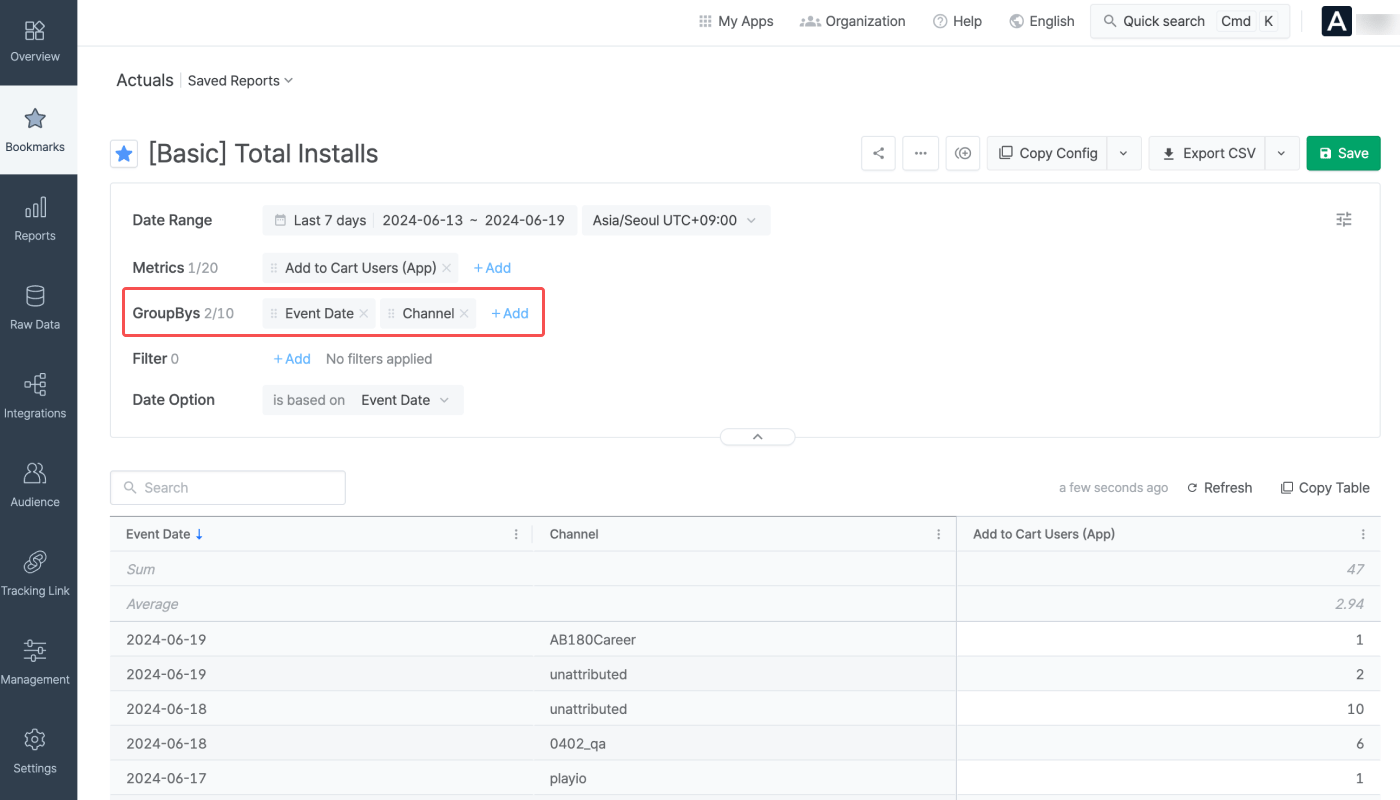
The metric data is grouped by the selected GroupBys. Configuring the GroupBy is optional and up to 10 GroupBys can be configured. You can rearrange the order of the GroupBys by dragging the GroupBy chips.
### Filter
Filters can be configured to display specific data in the chart and table. Select the filter option, operator, and value to configure a filter. Properties collected at least once are available as the filter option.
Filters can be also configured by clicking `=` or `≠` that appears when hovering over the GroupBy rows.
## Understanding the Actuals Report
The Actuals Report provides the data in table format. The report can be exported as a CSV file. You can also save your report settings to revisit the same report whenever needed.
### Metrics and GroupBys
You can customize your report view by selecting the right metrics and GroupBys. Refer to the following examples.
In the Airbridge dashboard, go to \[Reports]>\[Actuals Report] and configure the following.
* Date range: Set the period you want to view.
* Metric: Select 'Installs (App)'.
* GroupBy: Select 'Channel'.
1. Select Installs (App) as metric.
2. Select Short Link ID as GroupBy. The Short Link ID is the unique identifier of tracking links.
3. Click **Apply** to apply all configurations.
### Table
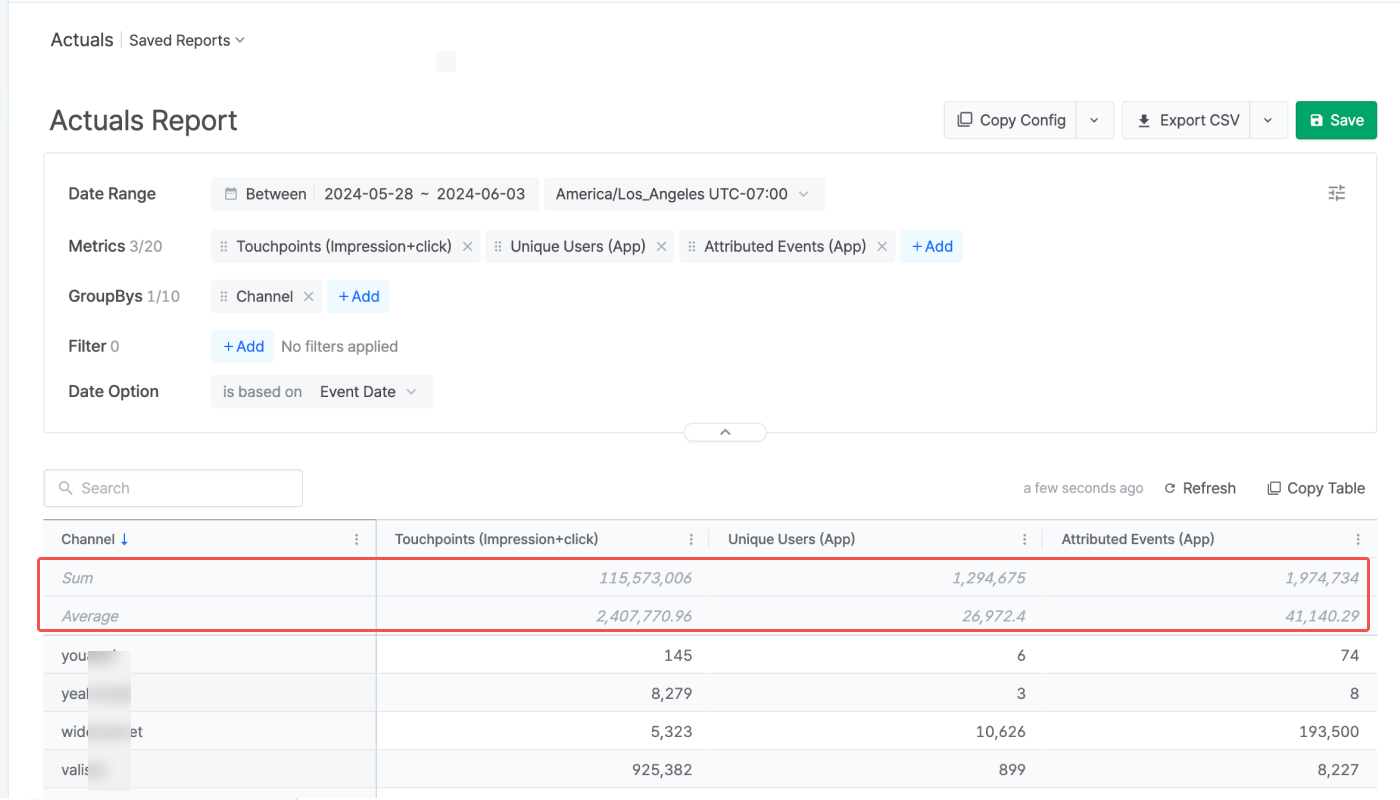
The data in the Actuals Report is presented in a table where the sum and average value of each field are visible.
### Supported features
Airbridge supports various features across its reports, from saving reports to sharing them with others.
The table shows the general features supported by Airbridge reports. Some features are not available in certain reports.
| Feature | Description |
| --------------------------------------------------------------------------- | ----------------------------------------------------------------------------------------------------------------------------------------------------------------------- |
| Refresh | Reload data with the existing report configuration. The time passed since the time the data was loaded appears next to the **Refresh button** or **Copy Table button**. |
| Wide controls | Configure the report on a wider panel. |
| Search | Search the report by keywords. |
| Expand/Collapse | Expand or collapse the configuration box. |
| Report naming | Name the report and save it for later use. |
Refer to the table below to learn how to share your report with others.
| Feature | Description |
| --------------------------------------------------------------------------- | ------------------------------------------------------------------------------------------------------------------------------------------------------------------------------------------ |
| Use saved reports and bookmarks | Save your report view to share it with others. Bookmark saved reports to open them faster. |
| Copy Config | Click **Copy Config** to share the report with other Airbridge users regardless of their app roles and access settings. |
| Share Report URL | The Report URL is the URL assigned to each Airbridge report. By sharing the report URL with other Airbridge users with the same access level as yours, you can share the same report view. |
| Copy Table | Click **Copy Table** and paste the table into a spreadsheet or messenger. |
| Export CSV | Export the report as a CSV file or a Google Spreadsheet file. |
## Attention
The table below outlines the features and limitations of the Actuals Report.
| Supported features and limitations | Description |
| ------------------------------------------------------------------------------------------------------ | ------------------------------------------------------------------------------- |
| No. of metrics configurable | 20 |
| No. of GroupBys configurable | 10 |
| Timezone | The configured Airbridge App timezone. Configurable per report view. |
| Currency | The configured Airbridge App standard currency |
| Data visualized in | Tables |
| Data refresh cycle | Real-time, except for user count metric data (Refreshed every hour) |
| Aggregated data | App event data, web event data |
| Maximum no. of rows in the Airbridge dashboard | 10,000 rows |
| Maximum no. of rows in the CSV and Google Spreadsheet file | 500,000 rows |
| Data available of | Past 5 years (2023-02-01 and onwards) |
| Maximum date range configurable for a single report view | 400 days |
 ### Date range
The Actuals Report shows the metric data measured during the set date range. Use the calendar filter to configure the date range.
* Data provision period: 5 years (applied from February 1, 2023)
* Maximum period that can be configured for a report view: 400 days
The date range conditions available in the calendar filter are as follows.
### Date range
The Actuals Report shows the metric data measured during the set date range. Use the calendar filter to configure the date range.
* Data provision period: 5 years (applied from February 1, 2023)
* Maximum period that can be configured for a report view: 400 days
The date range conditions available in the calendar filter are as follows.
 ### Metrics
The data collected through tracking links, Airbridge SDK, and ad channels can be viewed in the Actuals Report based on the selected metrics. Up to 20 metrics can be configured to create a report view.
### Metrics
The data collected through tracking links, Airbridge SDK, and ad channels can be viewed in the Actuals Report based on the selected metrics. Up to 20 metrics can be configured to create a report view.
 ### Filter
Filters can be configured to display specific data in the chart and table. Select the filter option, operator, and value to configure a filter. Properties collected at least once are available as the filter option.
### Filter
Filters can be configured to display specific data in the chart and table. Select the filter option, operator, and value to configure a filter. Properties collected at least once are available as the filter option.
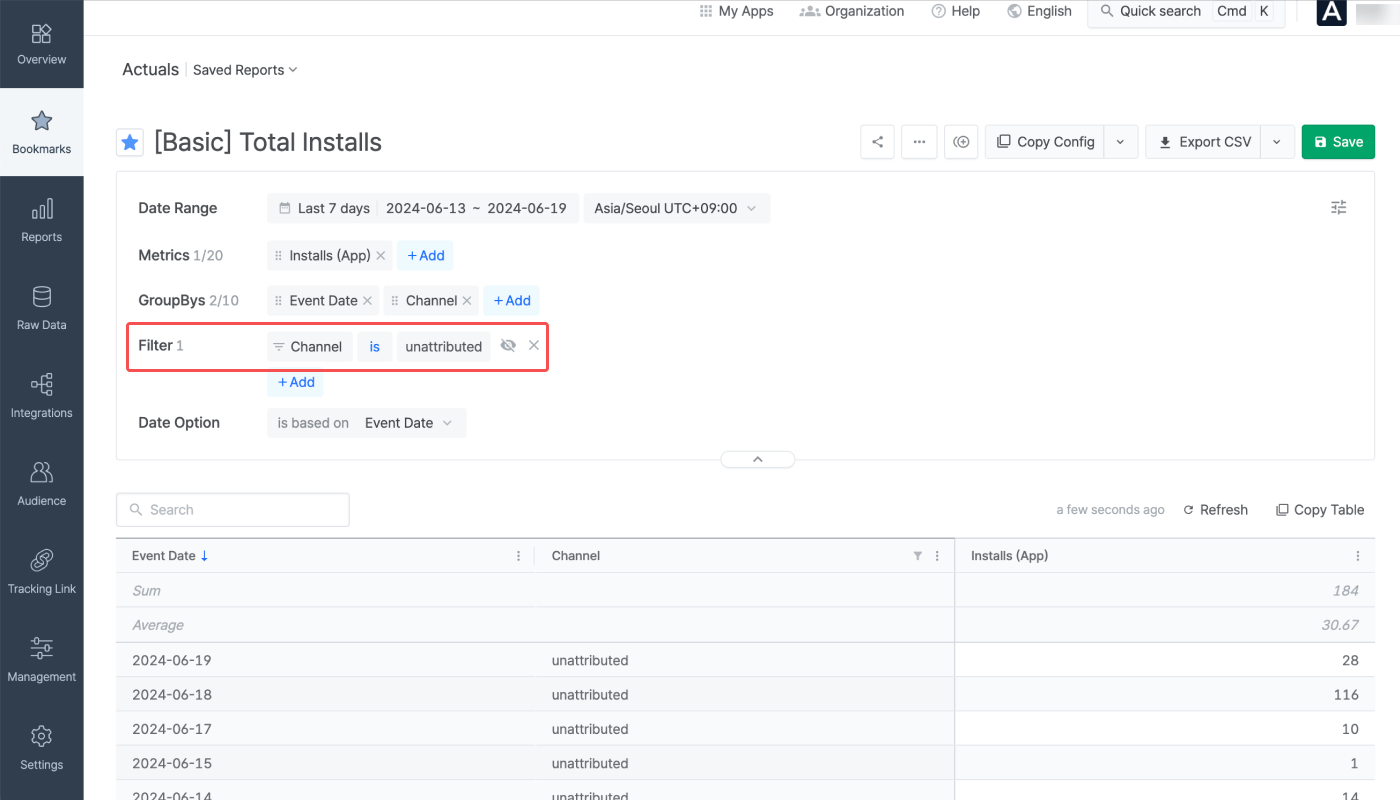 Filters can be also configured by clicking `=` or `≠` that appears when hovering over the GroupBy rows.
## Understanding the Actuals Report
The Actuals Report provides the data in table format. The report can be exported as a CSV file. You can also save your report settings to revisit the same report whenever needed.
### Metrics and GroupBys
You can customize your report view by selecting the right metrics and GroupBys. Refer to the following examples.
Filters can be also configured by clicking `=` or `≠` that appears when hovering over the GroupBy rows.
## Understanding the Actuals Report
The Actuals Report provides the data in table format. The report can be exported as a CSV file. You can also save your report settings to revisit the same report whenever needed.
### Metrics and GroupBys
You can customize your report view by selecting the right metrics and GroupBys. Refer to the following examples.
 ### Supported features
Airbridge supports various features across its reports, from saving reports to sharing them with others.
### Supported features
Airbridge supports various features across its reports, from saving reports to sharing them with others.